What Is a Trend in Trading? Uptrends, Downtrends and Ranges

What Is a Trend in Trading?
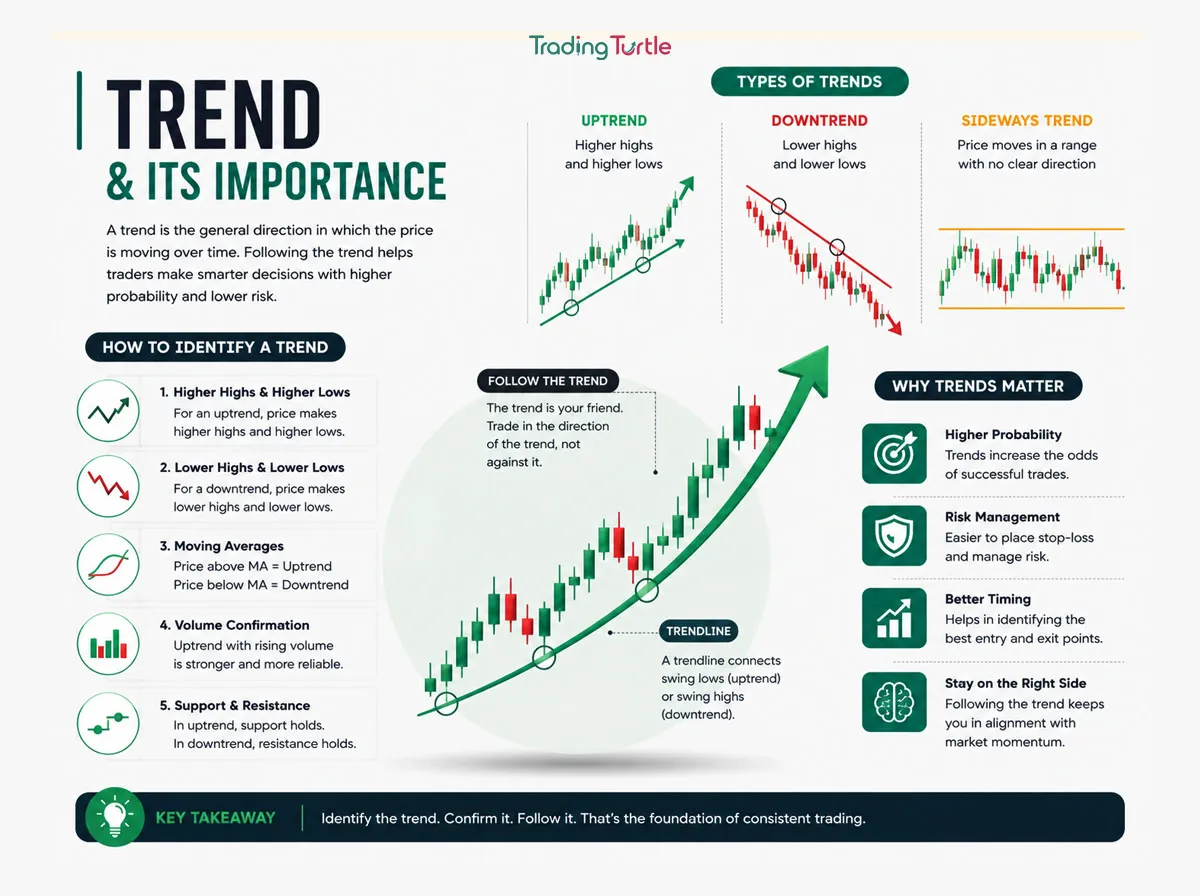
What is a trend in trading? A trend is the general direction in which the price of an asset is moving over a chosen period. A market can trend upward, trend downward, or move sideways within a range.
Understanding what is a trend in trading helps traders avoid treating every price movement as random. A trend gives context for chart patterns, support and resistance, candlestick signals, trade direction, position sizing, and exit planning.
An uptrend generally forms higher highs and higher lows. A downtrend generally forms lower lows and lower highs. When neither buyers nor sellers create a sustained direction, price may move sideways in a range.
The National Centre for Financial Education describes a trend as the general direction in which a security or market is headed. It identifies an uptrend as higher highs and higher lows, and a downtrend as lower lows and lower highs.
Why Trends Matter
The answer to what is a trend in trading matters because markets do not move in a straight line. Even a strong uptrend includes pullbacks, and even a strong downtrend includes rallies. Trend analysis helps traders distinguish a possible pullback from a broader reversal.
A trader who understands market direction can make more informed decisions about whether a setup aligns with the larger price structure. For example, a bullish candlestick pattern near support may have more context when the higher-time-frame market structure is upward rather than downward.
Trend identification does not predict the future. It helps traders organise probabilities, identify invalidation points, and avoid taking trades simply because a single indicator or candle looks attractive.
NSE describes technical analysis as a trend-following approach that uses chart patterns to analyse market movements and understand trends.
The Three Main Trend Types
The simplest way to understand what is a trend in trading is to recognise the three main market conditions: uptrend, downtrend, and sideways range.
Uptrend
An uptrend occurs when price broadly moves higher over time. It is commonly identified by a sequence of higher swing highs and higher swing lows.
In an uptrend:
- Buyers generally regain control after pullbacks.
- Previous resistance zones may become support areas.
- Traders may look for bullish setups aligned with the broader direction.
- Pullbacks may create opportunities, but they can also become reversals.
An uptrend is not confirmed by one green candle. It is a repeated structural pattern over several price swings.
Downtrend
A downtrend occurs when price broadly moves lower over time. It is commonly identified by lower swing lows and lower swing highs.
In a downtrend:
- Sellers generally regain control after rallies.
- Previous support zones may become resistance areas.
- Traders may become cautious about buying simply because price has fallen.
- Countertrend rallies can be sharp and unpredictable.
A downtrend can continue longer than traders expect. Trying to catch a bottom without a defined plan can create significant risk.
Sideways trend or range
A sideways market occurs when price moves broadly between support and resistance without sustained higher highs or lower lows.
In a range:
- Buyers may become active near support.
- Sellers may become active near resistance.
- Breakouts and breakdowns can fail.
- Trend-following indicators may generate frequent false signals.
A range is still a market condition, not an absence of structure. It simply requires a different trading approach or greater patience.
How to Identify a Trend
To identify what is a trend in trading, begin with price structure before using indicators. Price is the direct record of where transactions occurred; indicators are calculations based on that price.
Step 1: Choose a relevant time frame
A day trader may start with a daily or hourly chart for broader context, then use a shorter chart for execution. A swing trader may use weekly, daily, and four-hour charts.
The time frame should match your holding period. A five-minute trend is not necessarily relevant to a trader holding positions for several weeks.
Step 2: Mark swing highs and swing lows
A swing high is an area where price rose, then turned lower. A swing low is an area where price fell, then turned higher.
Compare the most recent swings:
- Higher highs and higher lows may indicate an uptrend.
- Lower highs and lower lows may indicate a downtrend.
- Overlapping highs and lows may indicate a range.
Step 3: Check support and resistance
In an uptrend, prior resistance may become support after a breakout. In a downtrend, prior support may become resistance after a breakdown.
Read Support and Resistance for a detailed guide to marking these decision zones.
Step 4: Review the quality of movement
Look for whether price moves cleanly, whether pullbacks are controlled, and whether the market holds important levels. A trend with erratic gaps, wide spreads, or low liquidity may be harder to trade despite its apparent direction.
Step 5: Define the invalidation point
Trend analysis is useful only if you know what would prove your view wrong. For example, an uptrend thesis may weaken if price makes a lower low and fails to recover a prior level.
Market Structure: Highs and Lows
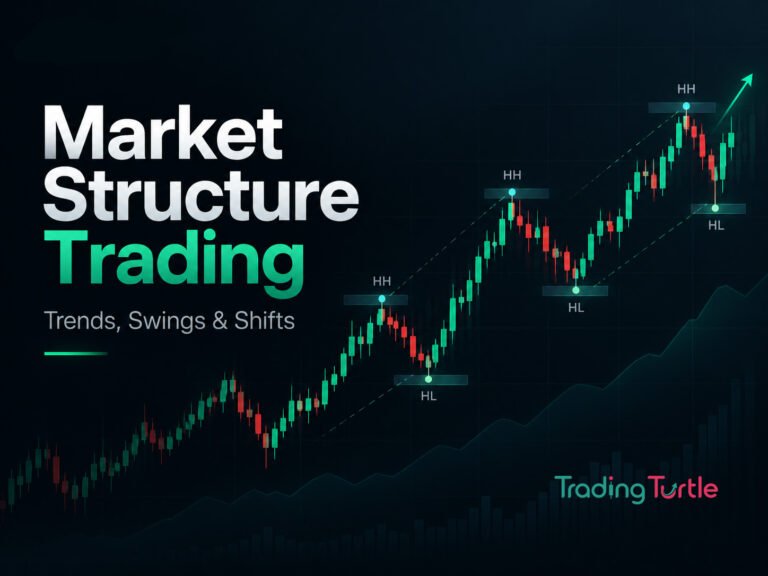
Market structure is the foundation of what is a trend in trading. Instead of predicting a future move, it describes the sequence of highs and lows already visible on the chart.
Higher highs and higher lows
In a rising market, price pushes to a new high, pulls back, and then holds above the previous meaningful low. This creates a higher low. If price later makes another high, the upward structure remains intact.
This does not mean every pullback is buyable. The trader still needs an entry trigger, a logical stop-loss, suitable position size, and enough potential reward relative to risk.
Lower highs and lower lows
In a falling market, price drops to a new low, rallies, and then fails below the previous meaningful high. This creates a lower high. If price later makes another low, the downward structure remains intact.
Traders should be careful about assuming an asset is “cheap” because it has already fallen. Price can continue lower when the market structure remains bearish.
Structure breaks
A structure break occurs when price violates a key swing point. In an uptrend, breaking below a meaningful higher low may signal weakening structure. In a downtrend, breaking above a meaningful lower high may signal possible change.
One break alone may not confirm a full reversal. Markets can create temporary false breaks, especially around news, low liquidity, or highly watched price levels.
Trend Time Frames
A key part of what is a trend in trading is understanding that trends depend on the chosen time frame.
Primary trend
The primary trend is the broadest market direction, often visible on weekly or monthly charts. Long-term investors and positional traders may pay close attention to this structure.
Intermediate trend
The intermediate trend may last days or weeks. Swing traders often focus here because it can provide meaningful movement without requiring constant intraday monitoring.
Short-term trend
The short-term trend may last hours or days. Intraday traders often use it for timing entries and exits.
A market can be in a primary uptrend, an intermediate pullback, and a short-term downtrend at the same time. This is why time-frame alignment matters.
A simple top-down example
- Weekly chart: Price remains above a major long-term support zone.
- Daily chart: Price is making higher highs and higher lows.
- Four-hour chart: Price pulls back into support.
- One-hour chart: Price forms a possible bullish reversal structure.
This does not guarantee a trade will work. It gives a structured way to decide whether a lower-time-frame setup aligns with the broader trend.
Trend Strength and Momentum
A trend can be upward or downward without being equally strong at all times. Traders often assess strength by observing price behaviour, volume, volatility, and the quality of pullbacks.
Signs of a stronger trend
A stronger trading trend may show:
- Clear directional movement.
- Consistent higher highs and higher lows, or lower highs and lower lows.
- Pullbacks that remain controlled.
- Breakouts that hold rather than immediately fail.
- Strong closes in the direction of the trend.
- Increased participation during impulse moves.
Signs of a weakening trend
A trend may be losing strength when:
- New highs or lows fail to extend meaningfully.
- Pullbacks become deeper or more volatile.
- Breakouts repeatedly fail.
- Price begins breaking important swing levels.
- Candles show repeated rejection near trend extremes.
- Price becomes increasingly choppy and overlapping.
Volume can provide additional context. However, higher volume does not guarantee continuation because it can also occur during exhaustion, liquidation, or reversal.
The CFTC notes that technical analysis of futures markets uses charts to plot price trends, price averages, and trading volume.
Using Trendlines Carefully
A trendline is a diagonal line drawn across swing lows in an uptrend or swing highs in a downtrend. It can help visually organise direction, but it should not be treated as an exact barrier.
Drawing an uptrend line
In an uptrend, connect two or more significant swing lows. The line may show where buyers have repeatedly entered during pullbacks.
Drawing a downtrend line
In a downtrend, connect two or more significant swing highs. The line may show where sellers have repeatedly entered during rallies.
Limits of trendlines
Trendlines can be drawn differently by different people. A small change in anchor points may alter the angle and the apparent breakout point. Use them as visual context alongside horizontal support and resistance—not as a standalone rule.
A trendline break can signal weakening momentum, but it does not always mean the main trend has reversed. Price may break a line, consolidate, and resume in the original direction.
Moving Averages and Trends
Moving averages smooth past prices to help traders see broader direction. They are commonly used as part of trading trend analysis, but they are lagging tools and should not replace market-structure analysis.
Simple moving average
A simple moving average calculates the average closing price over a selected number of periods. For example, a 50-day simple moving average uses the average closing price of the previous 50 days.
Exponential moving average
An exponential moving average gives more weight to recent price data. It may react faster to changes than a simple moving average, but it can also react more often to short-term noise.
How traders use moving averages
Traders may use moving averages to:
- Observe whether price is broadly above or below an average.
- Identify potential dynamic support or resistance.
- Compare shorter and longer averages for momentum context.
- Filter trades against the broader direction.
No moving-average crossover guarantees a trend. In sideways markets, averages may cross repeatedly and create misleading signals.
Trend Reversals and Trend Changes
A reversal is a meaningful shift from an uptrend to a downtrend or from a downtrend to an uptrend. Identifying reversals early is difficult because a pullback can look like a reversal until the original trend resumes.
Possible signs of a reversal
Traders may watch for:
- A break of a significant swing low or high.
- Failure to make a new high in an uptrend or a new low in a downtrend.
- A shift from higher highs to lower highs, or lower lows to higher lows.
- A breakdown or breakout from a major structure.
- Strong price rejection near an important level.
- Increased volatility or participation during the structural change.
These are clues, not confirmations by themselves. Trend changes should be assessed over multiple price swings and time frames.
Pullback versus reversal
A pullback is a temporary move against the main direction. A reversal is a more durable change in structure.
For example, a stock in an uptrend may fall for several days but remain above its prior meaningful higher low. This may still be a pullback. If it breaks that low, creates a lower high, and continues lower, the case for reversal becomes stronger.
Trading Ranges
A range occurs when price repeatedly moves between broadly defined support and resistance without sustained directional structure. Ranges can be frustrating for trend traders because price often reverses before a trend fully develops.
Identifying a range
A range may show:
- Repeated rejection near a similar upper zone.
- Repeated buying near a similar lower zone.
- Overlapping candles and swings.
- Moving averages that flatten or cross frequently.
- Breakouts that repeatedly fail and return inside the range.
Trading a range carefully
Some traders look for opportunities near the range boundaries rather than in the middle. Others wait for a confirmed breakout or breakdown before participating.
Neither approach guarantees success. Range trades can fail when the market breaks out, while breakout trades can fail when price returns inside the range.
How to Trade With a Trend
Trading with the broader trading trend generally means looking for setups that align with the established direction rather than repeatedly betting against it.
In an uptrend
A trader may look for:
- A broader sequence of higher highs and higher lows.
- A pullback toward a support zone or previous breakout area.
- A completed candlestick confirmation or regained short-term structure.
- A logical invalidation point below support.
- Position size based on the distance to the stop-loss.
- A target or exit process that accounts for the next resistance zone.
In a downtrend
Where appropriate and permitted for the chosen product, a trader may look for:
- A broader sequence of lower highs and lower lows.
- A rally toward resistance or a prior breakdown area.
- A bearish confirmation or renewed lower-time-frame weakness.
- A logical invalidation point above resistance.
- Position size based on total planned risk.
- A target or exit process near the next support zone.
In a range
A trader may wait for:
- Confirmation near a range boundary.
- A clear break and hold above or below the range.
- A retest that confirms a breakout or breakdown.
- A position size that accounts for false-break risk.
Before acting on any setup, review Risk Management in Trading and ensure the planned loss fits within your rules.
Risk reminder: Following a trend does not eliminate risk. Trends can reverse sharply during news, policy announcements, earnings, low-liquidity periods, or broad market stress. Use a defined exit plan and avoid increasing position size simply because a trend appears strong.
Common Mistakes
Avoid these common mistakes when learning what is a trend in trading:
- Calling a trend based on one or two candles.
- Ignoring the time frame and trading against a higher-time-frame trend without a clear reason.
- Assuming every pullback is a buying or selling opportunity.
- Treating a trendline as an exact support or resistance level.
- Using moving-average crossovers without checking price structure.
- Chasing a trend after a large move when the logical stop-loss is too far away.
- Ignoring liquidity, spread, and slippage.
- Confusing a temporary structure break with a confirmed reversal.
- Trading a range as if it were a strong trend.
- Increasing leverage because the market direction seems obvious.
- Ignoring scheduled news, earnings, economic data, or major market events.
Key Takeaways
- What is a trend in trading? It is the general direction of price over a selected time frame.
- An uptrend generally shows higher highs and higher lows.
- A downtrend generally shows lower highs and lower lows.
- A range occurs when price moves sideways between broadly defined support and resistance zones.
- Market structure should be assessed before relying on indicators or trendlines.
- Higher-time-frame trends provide context; lower time frames can help refine execution.
- Moving averages and trendlines are supporting tools, not guaranteed signals.
- A pullback is not necessarily a reversal, and a structure break is not always permanent.
- Trend following still requires position sizing, liquidity checks, stop-loss planning, and maximum-loss limits.
Educational disclaimer: This article is for educational purposes only and is not financial, investment, tax, or legal advice. Trends can reverse, pause, or become volatile without warning. Technical analysis cannot guarantee price direction, and trading can result in partial or total loss of capital.
– Frequently Asked Questions (FAQs)
A trend in trading is the overall direction of an asset’s price over time. It can move upward, downward, or sideways.
An uptrend is commonly identified by a sequence of higher highs and higher lows. Traders may also use support and resistance, moving averages, volume, and multiple time frames for additional context.
A pullback is a temporary move against the main trend. A reversal is a more durable change in market structure. A meaningful break of key swing levels and follow-through may help distinguish the two, but certainty is not possible.
Yes. A market can be in a longer-term uptrend while showing a short-term downtrend or pullback. This is why traders often use multiple time frames to understand context and refine entries.
No. Moving averages can help show direction, but they are based on past price data and can give frequent false signals in a sideways market. Combine them with price structure, support and resistance, volume, liquidity, and risk management.
Trend trading can be easier to understand than trying to predict every reversal, but it still requires a written plan, appropriate position size, disciplined exits, and an understanding of market and execution risk.