Candlestick Patterns for Beginners: How to Read Trading Candles

Candlestick Patterns Explained
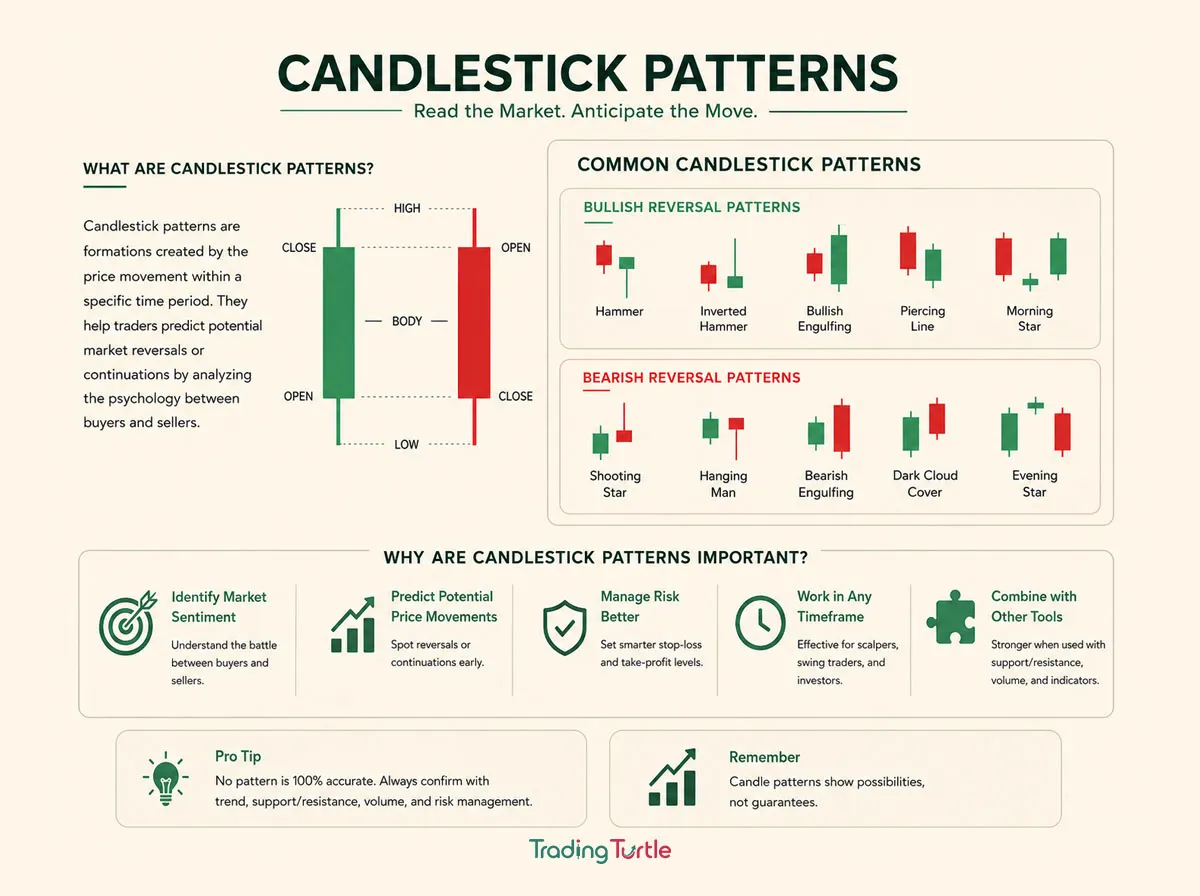
Candlestick patterns are visual price formations created by one or more candles on a chart. Each candle shows how an asset moved during a selected time period by displaying its opening, high, low, and closing price.
For traders, candlestick patterns for beginners are useful because they turn raw price movement into a readable visual record of buying pressure, selling pressure, indecision, rejection, and momentum. A candle does not tell you what will definitely happen next. It gives context about what happened during that period and may help you build a more structured trading plan.
Candlestick patterns can be used in stocks, indices, commodities, futures, forex, and crypto. However, the quality of a setup can vary widely depending on the broader trend, nearby support and resistance, volume, liquidity, time frame, market news, and risk management.
NSE includes Japanese candlesticks among the technical-analysis topics covered in its market-education programmes, alongside price patterns and indicators.
What Is a Candlestick Chart?
A candlestick chart displays the movement of an asset during a chosen period. That period could be one minute, five minutes, one hour, one day, one week, or any other chart interval offered by the platform.
Each candle represents four important prices:
- Open: The first traded price during the selected period.
- High: The highest traded price during that period.
- Low: The lowest traded price during that period.
- Close: The final traded price during that period.
This is often called OHLC data: open, high, low, and close.
Candlestick charts are popular because they show more detail than a simple line chart. A line chart usually connects closing prices, while a candlestick can show the full price range and whether buyers or sellers had more control by the end of the period.
FINRA explains that a candlestick chart uses a body and wick structure: the body represents the relationship between opening and closing prices, while the wicks show the high and low reached during the time frame.
Parts of a Candlestick
Understanding the structure of one candle is essential before learning individual candlestick patterns.
The real body
The body is the thicker central part of the candle. It shows the distance between the open and close.
- A larger body usually means price moved strongly between the open and close.
- A smaller body suggests less difference between the open and close.
- The body does not show the entire range; that is what the wicks show.
Upper wick
The upper wick, also called an upper shadow, shows the highest price reached during the period when that high is above the body.
A long upper wick can suggest that price traded higher but faced selling pressure before the period closed. It is not automatically a sell signal; context matters.
Lower wick
The lower wick, also called a lower shadow, shows the lowest price reached during the period when that low is below the body.
A long lower wick can suggest that price traded lower but found buying interest before the close. It is not automatically a buy signal.
Candle colour
Platforms may use different colours, but many use green or white for a candle that closes above its open, and red or black for a candle that closes below its open.
Colour conventions are visual shortcuts, not analysis by themselves. Always verify your chart settings, especially when switching platforms.
Bullish, Bearish and Neutral Candles
A candle can provide a first impression of whether buyers or sellers controlled that period.
Bullish candle
A bullish candle closes above its opening price. It often appears green or white, depending on the platform.
A strong bullish candle with a large body may show strong buying during that period. However, it may appear at the end of an extended rise, where chasing it could create poor risk-reward conditions.
Bearish candle
A bearish candle closes below its opening price. It often appears red or black.
A large bearish body may show strong selling pressure. But one large bearish candle after a long decline may also occur near a support zone, where selling pressure could be nearing exhaustion.
Neutral or small-body candle
A small-body candle shows that the open and close were close together. This can suggest indecision or balance between buyers and sellers, particularly after a strong move.
The candlestick patterns for beginners lesson here is simple: no candle is bullish or bearish without context. Location and surrounding market structure matter more than colour alone.
Why Context Matters
Candlestick patterns become more useful when they appear in the right context. The same hammer-shaped candle can have different implications depending on whether it appears after a long decline, in the middle of a sideways range, or near a major resistance zone.
Trend context
A pattern that suggests a possible bullish reversal may deserve more attention after a sustained decline than after a sharp upward rally. Likewise, a bearish pattern may be more relevant near resistance after a prolonged rise than in the middle of a strong downtrend.
Support and resistance
A reversal-shaped candle near a known support or resistance zone may be more meaningful than the same candle in an unimportant area of the chart.
Read Support and Resistance to understand how traders identify decision zones.
Volume and participation
Higher volume can show more participation during a candle or pattern. But volume alone cannot validate a pattern. It can increase during a failed move, panic selling, or a news-driven reversal.
Liquidity and spread
A candle may look clean on a chart while the instrument remains difficult to trade because of a wide spread or thin market depth. Check execution conditions before entering any position.
Visit What Is Liquidity in Trading? and Bid-Ask Spread Explained for execution fundamentals.
Risk reminder: A candlestick pattern is not a trading command. Before entering, define the trend context, support or resistance zone, entry condition, stop-loss level, position size, and maximum loss you are prepared to accept.
Single-Candle Patterns
Single-candle candlestick patterns describe the shape of one completed candle. They can signal possible rejection, indecision, or momentum, but they need confirmation from price action and market context.
Doji
A doji has a very small body because the open and close are near each other. It suggests indecision during the selected period.
A doji after a long trend may signal that momentum is slowing, but it does not confirm reversal. Price can pause briefly and then continue in the same direction.
Hammer
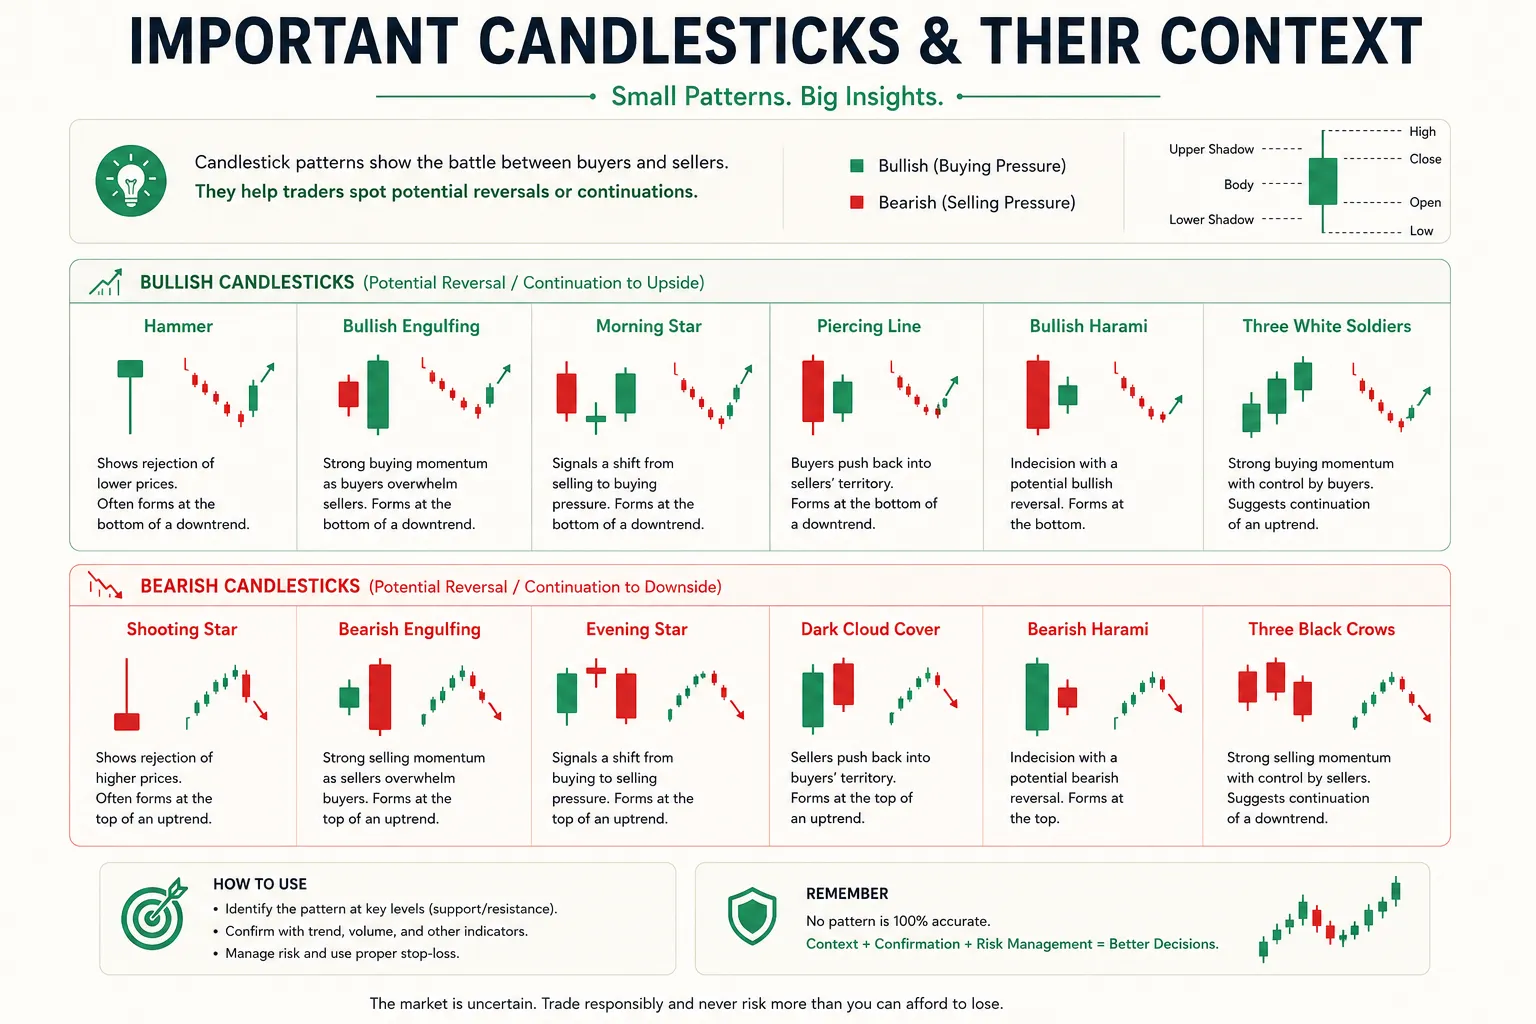
A hammer typically has a small body near the upper part of the candle and a long lower wick. It shows that price moved lower during the period but recovered before closing.
Traders often watch for a hammer after a decline and near support. Confirmation may come from the next candle closing higher, a reclaim of a level, or stronger volume.
Shooting star
A shooting star typically has a small body near the lower part of the candle and a long upper wick. It shows that price moved higher but faced selling before the close.
Traders may watch for it after an advance and near resistance. Confirmation is still needed because a strong uptrend can continue despite one rejection candle.
Marubozu
A marubozu is a candle with a large body and little or no visible wick. A bullish marubozu may show strong buying through the period, while a bearish marubozu may show strong selling.
It can indicate momentum, but entering after a large candle without checking nearby support, resistance, or risk distance can lead to chasing.
Spinning top
A spinning top has a relatively small body with wicks on both sides. It can suggest balance or indecision between buyers and sellers.
Like a doji, it is most useful when considered after a meaningful move and near an important market area.
Two-Candle Patterns
Two-candle candlestick patterns compare the relationship between consecutive candles. They can show a shift in short-term control between buyers and sellers.
Bullish engulfing
A bullish engulfing pattern commonly occurs when a larger bullish candle’s body covers the previous bearish candle’s body. It can suggest that buying pressure has overtaken selling pressure.
The pattern may be more relevant after a decline and near support. Traders should still assess the broader trend, volume, and confirmation from the next price movement.
Bearish engulfing
A bearish engulfing pattern commonly occurs when a larger bearish candle’s body covers the previous bullish candle’s body. It can suggest that selling pressure has overtaken buying pressure.
It may be more relevant after an advance near resistance. It is not automatically a reason to short, especially in a broader strong uptrend.
Inside bar
An inside bar occurs when the second candle’s full range falls within the first candle’s range. It often signals a temporary contraction in volatility.
An inside bar can lead to continuation or reversal. Its value comes from the surrounding trend, location, and the direction of the eventual break.
Tweezer top and tweezer bottom
A tweezer top may occur when two candles have similar highs near a potential resistance area. A tweezer bottom may occur when two candles have similar lows near possible support.
These formations can show repeated rejection of a level, but similar highs or lows alone are not enough to establish a reliable trade setup.
Three-Candle Patterns
Three-candle candlestick patterns attempt to show a more developed shift in sentiment. They can be easier to recognise after the fact, so traders should avoid forcing a label before the formation is complete.
Morning star
A morning star is generally described as a three-candle bullish reversal pattern that can appear after a decline. It commonly includes:
- A relatively strong bearish candle.
- A smaller candle showing hesitation or indecision.
- A stronger bullish candle showing renewed buying.
Its usefulness depends on location, confirmation, and the broader market context.
Evening star
An evening star is generally described as a three-candle bearish reversal pattern that can appear after an advance. It commonly includes:
- A relatively strong bullish candle.
- A smaller candle showing hesitation.
- A stronger bearish candle showing renewed selling.
It should not be treated as a guaranteed top. The broader trend may resume, particularly if the asset remains above key support.
Three white soldiers
Three white soldiers are three consecutive bullish candles that often close progressively higher. They may indicate sustained buying pressure after a decline or consolidation.
However, if they appear after an already extended rise, the move may be overextended. Traders should avoid assuming that three strong candles mean price cannot pull back.
Three black crows
Three black crows are three consecutive bearish candles that often close progressively lower. They may indicate sustained selling pressure after an advance or consolidation.
As with any pattern, it can appear after a move is already extended. Chasing a late bearish move near support can create poor risk-reward conditions.
How to Use Candlestick Patterns
The most practical way to use candlestick patterns is as a confirmation tool within a written plan, not as a standalone signal generator.
Start with the bigger picture
Use a higher time frame to identify whether the market is trending upward, trending downward, or moving sideways. A daily trend may provide context for a shorter intraday chart.
Mark important zones
Identify nearby support, resistance, range boundaries, swing highs, and swing lows. A pattern near a relevant zone may have more meaning than one in the middle of random price movement.
Wait for the candle to close
A candle can look bullish or bearish before the time period ends, then change completely before closing. Analyse completed candles rather than reacting prematurely.
Define confirmation
Confirmation may include a break of the pattern high or low, a close beyond a nearby level, an increase in participation, or a successful retest. The right confirmation depends on your strategy and time frame.
Define invalidation and size
Decide where the pattern is invalid before entering. Then use position sizing so the possible loss remains within your planned limit.
Read Risk Management in Trading before using any live trading setup.
Candlesticks Across Time Frames
Candlestick patterns appear across all time frames, but the meaning and reliability of a pattern can differ.
Short time frames
One-minute, five-minute, and fifteen-minute charts can show many patterns. They may be useful for execution, but they also contain more market noise and can be heavily affected by spread, order flow, and rapid volatility.
Medium time frames
Hourly and four-hour charts can be useful for swing-trading analysis. They provide more context than very short charts while still giving timely information.
Higher time frames
Daily, weekly, and monthly candles often represent more market activity and may be noticed by a wider set of participants. However, they also require wider stop distances and may be less suitable for traders seeking frequent opportunities.
The best time frame is not the one that produces the most signals. It is the one that fits your trading approach, schedule, risk tolerance, and ability to follow a plan.
Common Mistakes
Avoid these common errors when learning candlestick patterns for beginners:
- Treating every candle shape as a buy or sell signal.
- Entering before a candle has closed.
- Ignoring the broader market trend.
- Ignoring support, resistance, volume, liquidity, and spread.
- Using too many pattern names without understanding market structure.
- Taking reversal trades against a strong trend without confirmation.
- Setting a stop-loss too close to normal volatility.
- Using excessive leverage because a pattern “looks perfect.”
- Failing to calculate position size before entering.
- Ignoring major news, earnings, or macroeconomic events.
- Expecting a pattern to perform the same way in stocks, options, crypto, and low-liquidity markets.
NSE’s educational content frames technical analysis around charts, indicators, and patterns, while its programmes also emphasise broader price and market analysis rather than a single signal.
Key Takeaways
- Candlestick patterns are one- to three-candle formations that show how price moved during selected time periods.
- Each candle contains open, high, low, and close information.
- The body shows the relationship between the open and close; wicks show the period’s high and low.
- Common single-candle patterns include doji, hammer, shooting star, marubozu, and spinning top.
- Common multi-candle patterns include engulfing patterns, inside bars, morning stars, and evening stars.
- Candlestick patterns for beginners work best when combined with trend, support and resistance, volume, liquidity, and risk controls.
- Wait for a candle to close before treating its shape as valid.
- No pattern guarantees a reversal, continuation, profit, or exact execution price.
Educational Disclaimer: A candlestick pattern is not a trading command. Before entering, define the trend context, support or resistance zone, entry condition, stop-loss level, position size, and maximum loss you are prepared to accept.
– Frequently Asked Questions (FAQs)
Candlestick patterns are visual formations made by one or more candles on a price chart. They show the relationship between open, high, low, and close prices and can help traders assess momentum, rejection, or indecision.
Beginners can start by understanding basic candle structure, doji, hammer, shooting star, bullish engulfing, bearish engulfing, and inside bars. Focus on context and risk management instead of trying to memorise every pattern.
Candlestick patterns can provide useful context, but they are not guarantees. Their relevance depends on trend, support or resistance, volume, liquidity, volatility, time frame, and confirmation.
Yes, traders can use them on intraday charts. However, shorter time frames can contain more noise and may be more sensitive to spread, liquidity, slippage, and fast price movement.
A long wick shows that price moved away from the open or close during the period but later reversed part of that move. A long upper wick can show rejection of higher prices, while a long lower wick can show rejection of lower prices. Context is essential.
No. Use candlestick patterns with trend analysis, support and resistance, volume, liquidity checks, suitable order types, position sizing, and a predefined maximum loss.