What Is Technical Analysis? A Beginner’s Guide to Trading Charts

What Is Technical Analysis?
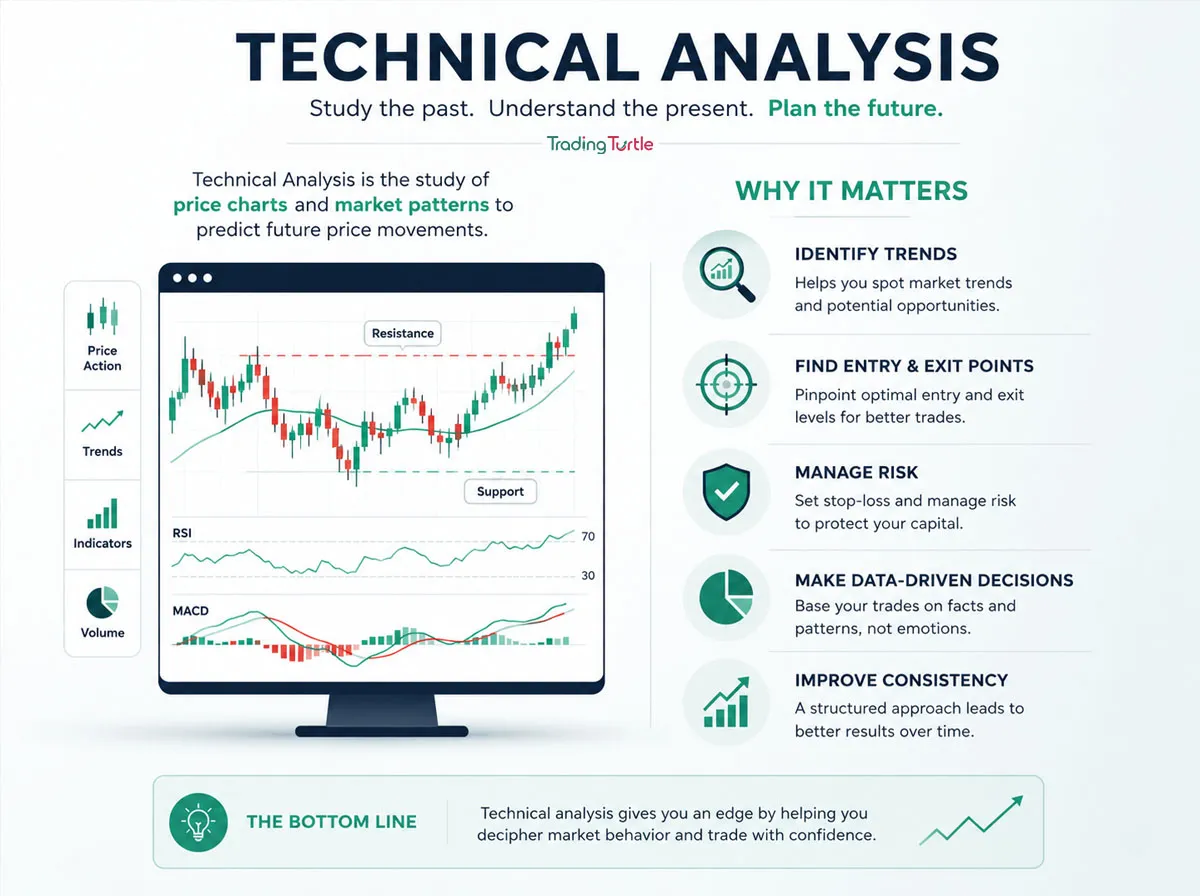
What is technical analysis? Technical analysis is a method of studying market price, trading volume, chart patterns, and other market data to evaluate possible future price movements. Traders use it to organise market information, identify trends, plan entries and exits, and manage risk.
The simple technical analysis meaning is “reading market behaviour through price and related data.” Instead of focusing primarily on a company’s earnings, business model, or valuation, technical analysis focuses on what market participants are doing through buying, selling, volume, momentum, and price structure.
Technical analysis can be used in stocks, indices, commodities, futures, forex, and crypto assets. However, the same chart tool can behave differently across instruments because liquidity, volatility, trading hours, regulation, and participant behaviour vary.
The National Stock Exchange of India describes technical analysis as a market-research technique that identifies opportunities through participants’ actions as analysed using technical charts, indicators, and patterns.
How Technical Analysis Works
To understand what is technical analysis, start with the idea that a market chart records the decisions of buyers and sellers. Every candle, price bar, volume increase, breakout, reversal, and failed move reflects changing demand and supply.
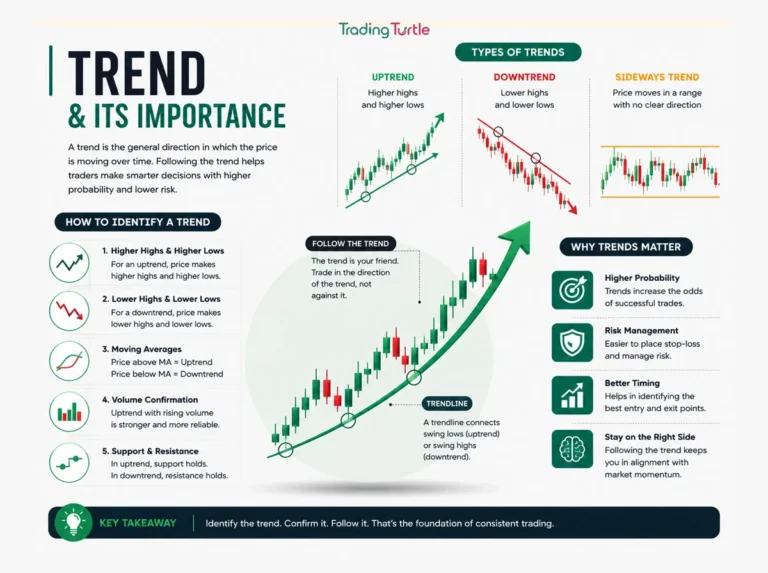
Technical analysts look at this information to develop scenarios rather than guarantees. For example, a trader may observe that an asset is making higher highs and higher lows. They may describe the market as being in an uptrend and look for a pullback that holds above a prior support area.
That does not mean the price must rise. It means the trader has a structured way to define the trend, the entry condition, the invalidation point, and the risk.
The basic technical-analysis process
- Select a market and time frame.
- Identify the broader price trend or range.
- Mark important support and resistance areas.
- Review volume, volatility, and liquidity.
- Wait for a specific entry condition.
- Define where the idea is wrong.
- Set position size based on planned risk.
- Monitor and review the outcome after the trade.
This process makes technical analysis more useful than simply drawing lines after price has already moved.
Technical vs Fundamental Analysis
Technical analysis and fundamental analysis are different approaches, but they can be used together.
| Factor | Technical analysis | Fundamental analysis |
|---|---|---|
| Primary focus | Price, volume, market structure, patterns and indicators | Business performance, financial statements, industry, valuation and economic factors |
| Main question | What is the market doing now? | What may an asset be worth over time? |
| Common time frames | Minutes, hours, days, weeks or months | Quarters, years and longer |
| Typical users | Active traders and market-timing investors | Long-term investors and analysts |
| Key tools | Charts, support, resistance, volume and indicators | Revenue, profits, debt, cash flow, management and valuation |
| Main limitation | Patterns can fail and signals can conflict | A strong business can still have weak short-term price action |
The technical analysis meaning is not “ignore all company or economic information.” Many traders combine both approaches. For example, an investor may use fundamental research to shortlist companies and technical analysis to plan an entry, exit, or risk level.
NSE investor-education material distinguishes technical analysis, which focuses on price movements, trends, and volume, from fundamental analysis, which focuses on financial health, business model, and economic factors.
The Core Ideas Behind Technical Analysis
The answer to what is technical analysis rests on a few central principles. These are working assumptions used to interpret market behaviour, not guaranteed rules.
Price reflects available information
Technical analysts assume that a market’s price reflects the combined effect of currently known information and participant expectations. This includes company news, macroeconomic conditions, sentiment, institutional activity, and trader positioning.
This does not mean price is always perfectly rational. It means price is the most direct record of what buyers and sellers are collectively willing to transact at.
Prices move in trends
Markets often move in upward trends, downward trends, or sideways ranges. Technical analysis attempts to identify the current structure instead of assuming every market must move in one direction.
An uptrend may show higher highs and higher lows. A downtrend may show lower highs and lower lows. A range may show price repeatedly moving between broadly defined support and resistance zones.
History can influence behaviour
Technical analysis assumes that traders may react around previously important price zones. A level where many market participants bought, sold, entered late, or exited under pressure can become relevant again because people remember and respond to prior price action.
However, historical levels are zones of interest, not guaranteed turning points.
Reading Price Charts
Price charts are the main workspace for technical analysis. They organise historical market movement into a visual format that helps traders compare current behaviour with past behaviour.
Line charts
A line chart usually connects closing prices. It provides a simple view of the broader trend but does not show the full range of price movement during each period.
Bar charts
A bar chart can show the opening, high, low, and closing price for each selected period. It gives more detail than a line chart.
Candlestick charts
Candlestick charts show the open, high, low, and close for a chosen period. The body represents the difference between the open and close, while the wicks show the highest and lowest prices reached during that period.
A single candle rarely tells the entire story. Its context matters: trend direction, nearby support or resistance, volume, volatility, and the time frame being used.
Time frames
A time frame determines how much price activity each candle or bar represents.
- A 5-minute chart groups activity into five-minute periods.
- A 1-hour chart groups activity into one-hour periods.
- A daily chart groups activity into one trading day.
- A weekly chart groups activity into one week.
The same asset can look bullish on a five-minute chart and bearish on a daily chart. That is not necessarily a contradiction; it reflects different views of the same market.
Trends and Market Structure
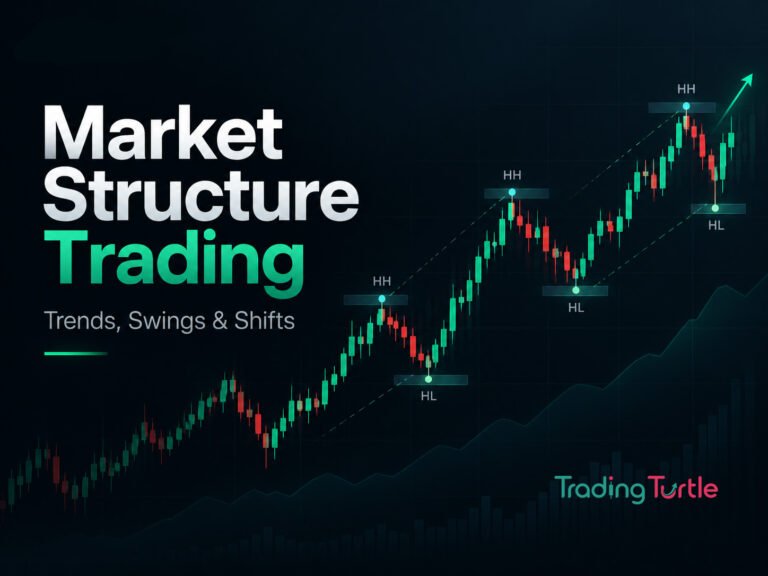
One practical answer to what is technical analysis is that it helps traders describe market structure clearly.
Uptrend
An uptrend is typically identified by higher swing highs and higher swing lows. Traders may look for pullbacks that hold above prior support rather than chasing a price after a sharp move.
Downtrend
A downtrend is typically identified by lower swing highs and lower swing lows. Traders may avoid long positions, look for short opportunities where permitted and appropriate, or wait for evidence that the downtrend has changed.
Sideways range
A sideways range occurs when price moves broadly between support and resistance without sustained higher highs or lower lows. Range conditions may suit some strategies but can create false breakouts and whipsaws.
Trend reversal
A reversal may occur when an established structure breaks down. For example, an uptrend may lose a prior swing low, then fail to recover. But one broken level alone may not be enough evidence. Traders often wait for confirmation rather than assuming a reversal immediately.
Support and Resistance
Support and resistance are among the most widely used technical-analysis concepts.
Support
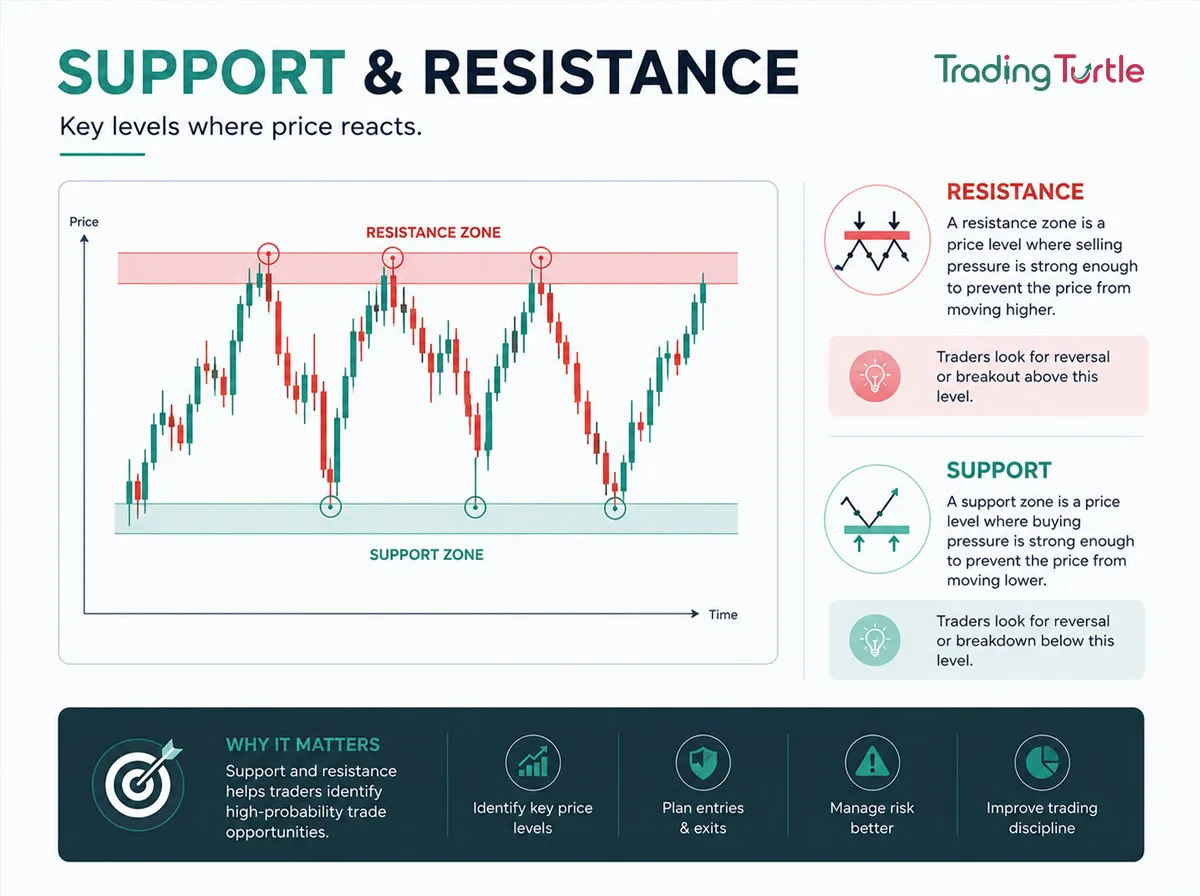
Support is an area where buying interest has previously appeared strong enough to slow or temporarily reverse a decline. It is better viewed as a zone than one exact number.
Resistance
Resistance is an area where selling interest has previously appeared strong enough to slow or temporarily reverse an advance. Like support, it is often a zone rather than a precise line.
Why these areas matter
Support and resistance can help traders plan entries, stops, and targets. For example, a trader may wait for a pullback near support and define a stop-loss below the area where the trade idea would be invalid.
But support can break, and resistance can be exceeded. A level becomes useful only when combined with market structure, price behaviour, volume, liquidity, and risk control.
Risk reminder: Support, resistance, indicators, and patterns are analytical tools—not promises. A level can fail quickly during high volatility, major news, low liquidity, or a broad market move.
Volume and Market Participation
Volume shows how much of an instrument traded during a selected period. It can provide context for price movement, but it does not provide a complete answer by itself.
A breakout with stronger-than-usual volume may indicate more participation than a breakout that occurs on weak activity. Similarly, a sharp move on low volume may deserve extra caution.
What volume can help show
- Whether participation increased during a price move.
- Whether a trend has broad or limited activity.
- Whether a breakout attracted interest.
- Whether a reversal area has unusually high trading activity.
- Whether a market is becoming less active.
What volume cannot guarantee
High volume does not guarantee that a trend will continue. Volume can increase during panic selling, forced liquidation, or a failed breakout. It must be interpreted in context.
Before trading, also check liquidity, bid-ask spread, and order-book depth. Visit What Is Liquidity in Trading? to understand why volume alone does not ensure easy execution.
Technical Indicators
Technical indicators are calculations derived from price, volume, or both. They can help organise observations, but they should not replace understanding of trend, structure, liquidity, and risk.
Moving averages
A moving average smooths price data over a selected period. Traders may use it to identify broader direction, dynamic support or resistance, or momentum changes.
A moving average is lagging by design because it is calculated from past prices. It can be helpful in a trend but may produce frequent false signals in a sideways market.
Relative Strength Index
The Relative Strength Index, or RSI, is a momentum indicator that compares recent gains and losses over a selected period. Traders often watch for momentum shifts, divergence, or conditions described as overbought and oversold.
“Overbought” does not automatically mean price must fall, and “oversold” does not automatically mean price must rise. Strong trends can remain extended for longer than expected.
Moving Average Convergence Divergence
MACD is a momentum and trend-following indicator built from moving averages. Traders may use it to observe momentum changes, crossovers, or divergence.
Like any indicator, MACD can generate delayed or false signals. It should be treated as one source of context, not a standalone trading command.
Volatility indicators
Tools such as Average True Range can help traders estimate normal price movement. This may support stop-loss placement and position sizing, but it cannot predict sudden gaps or news-driven moves.
Chart Patterns
Chart patterns are visual structures that traders believe may show continuation, consolidation, uncertainty, or reversal behaviour. Examples include triangles, flags, double tops, double bottoms, and head-and-shoulders formations.
Why pattern context matters
A pattern does not work simply because it has a name. Traders should examine:
- The broader trend before the pattern.
- The quality and duration of consolidation.
- Nearby support and resistance.
- Volume and liquidity.
- Breakout or breakdown behaviour.
- The distance to a logical stop-loss.
- Risk-reward conditions.
For example, a triangle near a major resistance zone may break upward, downward, or fail entirely. A trader needs a plan for more than one outcome.
How to Use Technical Analysis Responsibly
Technical analysis becomes more useful when it supports a repeatable decision process instead of impulsive prediction.
Use top-down analysis
Start with a higher time frame to understand the broader trend, then move to a lower time frame for a more precise setup. For example, a swing trader may review the weekly and daily charts before using a four-hour chart for entry planning.
NSE material describes a top-down approach in which investors analyse long-term and short-term charts when evaluating a stock.
Define invalidation before entry
Before entering a trade, identify the level or condition that proves the setup wrong. That may be a broken support zone, failed breakout, trend-structure change, or a maximum loss amount.
Combine analysis with position sizing
No chart setup justifies excessive risk. Position size should be based on the stop distance and your maximum acceptable loss—not how confident you feel.
Track outcomes
Keep a trading journal. Record the chart context, entry condition, stop level, target method, actual execution, and whether you followed the plan. Over time, this can reveal which setups work best for you and which mistakes repeatedly affect results.
Use paper trading carefully
Paper trading can help you practise chart reading and order placement without immediately risking capital. However, simulated fills may not fully reflect live spreads, slippage, liquidity, or emotional pressure.
Limitations and Risks
The answer to what is technical analysis must include its limitations. Technical analysis can help structure decisions, but it cannot remove uncertainty.
Signals can fail
A breakout can fail, a trend can reverse, and an indicator can provide conflicting information. No pattern or tool has a guaranteed success rate.
Data is historical
Charts show what happened, not what must happen next. Indicators are derived from historical prices and may react after a move has already begun.
Market conditions change
A strategy that appears effective in a trending market may struggle in a range. A setup developed for liquid large-cap shares may behave differently in small-cap stocks, options, crypto, or fast-moving derivatives.
News can override chart structure
Earnings, central-bank decisions, geopolitical events, policy changes, exchange incidents, and broader market shocks can produce abrupt movements that technical tools did not anticipate.
Psychology remains important
Fear, greed, impatience, revenge trading, and overconfidence can cause traders to ignore even a well-designed chart plan.
Common Beginner Mistakes
Avoid these common technical-analysis mistakes:
- Using too many indicators until the chart becomes confusing.
- Entering solely because one indicator gives a signal.
- Drawing support and resistance as exact, unbreakable lines.
- Ignoring higher-time-frame trend and market context.
- Treating a chart pattern as guaranteed.
- Using tight stops in highly volatile instruments without adjusting position size.
- Ignoring liquidity, bid-ask spread, slippage, and execution costs.
- Switching strategies after a small number of losses.
- Increasing leverage because a chart setup looks “certain.”
- Taking trades without writing the entry, invalidation, position size, and exit plan.
SEBI’s investor education material includes technical and fundamental analysis among its securities-market learning resources, but education should be paired with careful risk awareness and product understanding.
Key Takeaways
- What is technical analysis? It is the study of price, volume, chart structure, patterns, and indicators to evaluate possible market movement.
- The technical analysis meaning is not guaranteed prediction; it is a structured method for interpreting market behaviour.
- Technical analysis can be used in stocks, indices, commodities, forex, derivatives, and crypto, but execution conditions vary across markets.
- Trend, support, resistance, volume, liquidity, indicators, and chart patterns are foundational concepts.
- Indicators are tools for context, not standalone buy or sell signals.
- Strong analysis includes a defined entry, invalidation point, position size, and exit plan.
- Technical analysis has limits because market conditions, news, liquidity, and psychology can change quickly.
- Use charts alongside risk management principles, not as a substitute for them.
– Frequently Asked Questions (FAQs)
Technical analysis is the study of charts, price movement, volume, and market patterns to assess possible future price behaviour. It helps traders organise decisions but cannot predict markets with certainty.
No. Technical analysis can be used by intraday traders, swing traders, positional traders, and long-term investors. The tools and time frames change based on the person’s objective and holding period.
Technical analysis focuses on price, volume, trends, and market structure. Fundamental analysis focuses on business performance, financial health, valuation, management, and economic conditions.
There is no universally best indicator. Beginners should first learn price structure, support, resistance, volume, liquidity, and risk management. If using indicators, start with one or two and learn their limitations rather than combining many signals.
No. Technical analysis cannot guarantee outcomes. Price patterns and indicators can fail, and unexpected news, volatility, or liquidity changes can affect any trade.
Start by studying historical charts, marking trend structure and support or resistance zones, writing a trade plan, and using paper trading cautiously. Review every trade in a journal and focus on risk control before using meaningful capital.