Support and Resistance: How to Identify Key Trading Levels

Support and Resistance Explained
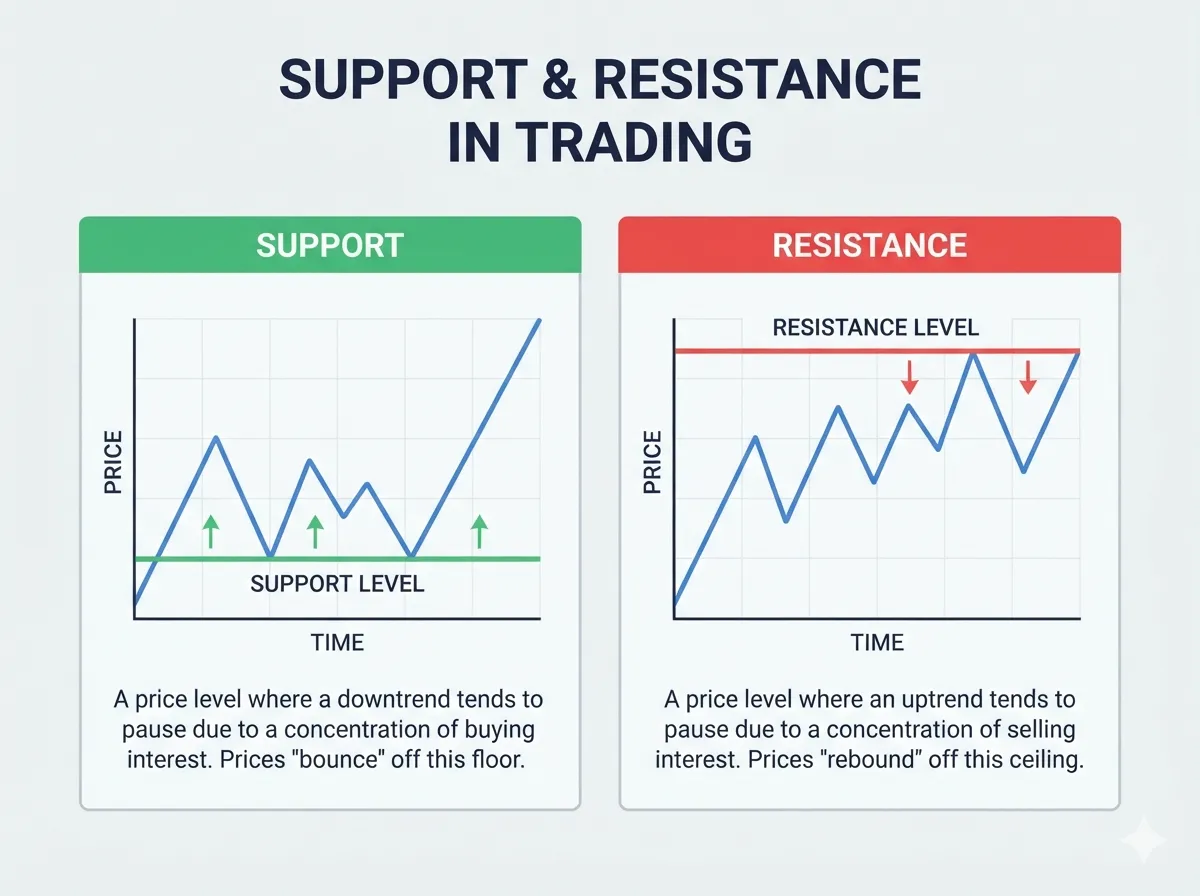
Support and resistance are price areas on a chart where buying or selling interest has previously become noticeable. Support is an area where a decline has slowed or reversed because buyers appeared, while resistance is an area where an advance has slowed or reversed because sellers appeared.
Traders use support and resistance to understand market structure, identify potential decision zones, plan trade entries, define invalidation points, and set realistic targets. These areas are not magic lines, exact predictions, or guaranteed reversal points. They are locations where market participants may react because of prior buying, selling, profit-taking, stop-loss activity, or changing expectations.
The U.S. Commodity Futures Trading Commission defines technical analysis as an approach that studies price-change patterns, rates of change, and trading-volume changes to forecast commodity prices. Within this broader approach, support and resistance help traders organise price behaviour into practical areas of interest.
Educational disclaimer: This article is for educational purposes only and is not financial, investment, tax, or legal advice. Support and resistance zones can fail, and no chart level guarantees a profitable trade. Always use position sizing, risk limits, and independent research before placing a trade.
What Is Support?
Support is a price area where falling prices have previously found enough buying interest to pause, slow down, or reverse upward. Traders often describe support as a “floor,” but it is more accurate to view it as a zone where demand may become stronger than nearby selling pressure.
For example, assume a stock falls near ₹400 several times and buyers repeatedly step in around that area. Traders may begin watching ₹400 as a potential support zone. If price returns there, some market participants may buy, others may cover short positions, and others may wait to see whether the zone holds.
Support does not mean price cannot fall below that area. It means that the area has shown prior demand and may be relevant again.
How support can form
Support can develop around:
- Prior swing lows.
- A previous consolidation area.
- A breakout level that price later revisits.
- A widely watched moving average.
- A major round-number area.
- A high-volume price zone.
- A longer-term weekly or monthly chart area.
The more evidence that aligns around a zone, the more closely traders may watch it. However, confluence improves context; it does not create certainty.
What Is Resistance?
Resistance is a price area where rising prices have previously faced enough selling interest to slow down, pause, or reverse lower. Traders often describe resistance as a “ceiling,” but it is better understood as an area where supply may become stronger than nearby demand.
For example, if a stock has risen toward ₹500 several times but repeatedly faced selling pressure around that zone, traders may watch ₹500 as resistance. Buyers who entered lower may take profits there, earlier holders may sell near breakeven, and short sellers may look for confirmation that the price is failing to break higher.
Like support, resistance can fail. If enough buyers are willing to transact above that zone, the price can break through and continue higher.
What resistance may indicate
Resistance may represent:
- A previous swing high.
- An all-time or multi-month high area.
- A prior breakdown zone.
- A high-volume supply zone.
- A round-number price area.
- A level visible on a higher time frame.
- A point where a prior rally stopped repeatedly.
Technical analysts use support and resistance levels to identify areas where buying or selling interest may affect price action, but the level itself is not an instruction to buy or sell.
Why Support and Resistance Work
The basic idea behind support and resistance is market memory and order flow. Traders, investors, institutions, and algorithms may notice prior price areas because those locations were associated with significant buying, selling, missed entries, profit-taking, or losses.
Market psychology
Suppose an investor bought a stock at ₹500, watched it fall to ₹450, and later saw it return to ₹500. They may decide to sell at breakeven. If many participants behave similarly, the ₹500 area can attract supply.
The opposite may happen near a prior low. Traders who missed an earlier bounce may consider buying if price revisits the same zone. Existing holders may also add, creating renewed demand.
Order placement
Support and resistance zones may attract limit orders, stop-losses, take-profit orders, and breakout orders. These orders can increase activity near a level, but they can also create sudden volatility when the zone breaks.
Shared attention
Technical levels become more meaningful when many participants see them. A major weekly high or a well-defined range boundary may receive more attention than a random intraday swing.
NSE educational material describes technical analysis as studying participant actions through charts, indicators, and patterns, including reversal and continuation patterns that may signal changes or pauses in trends.
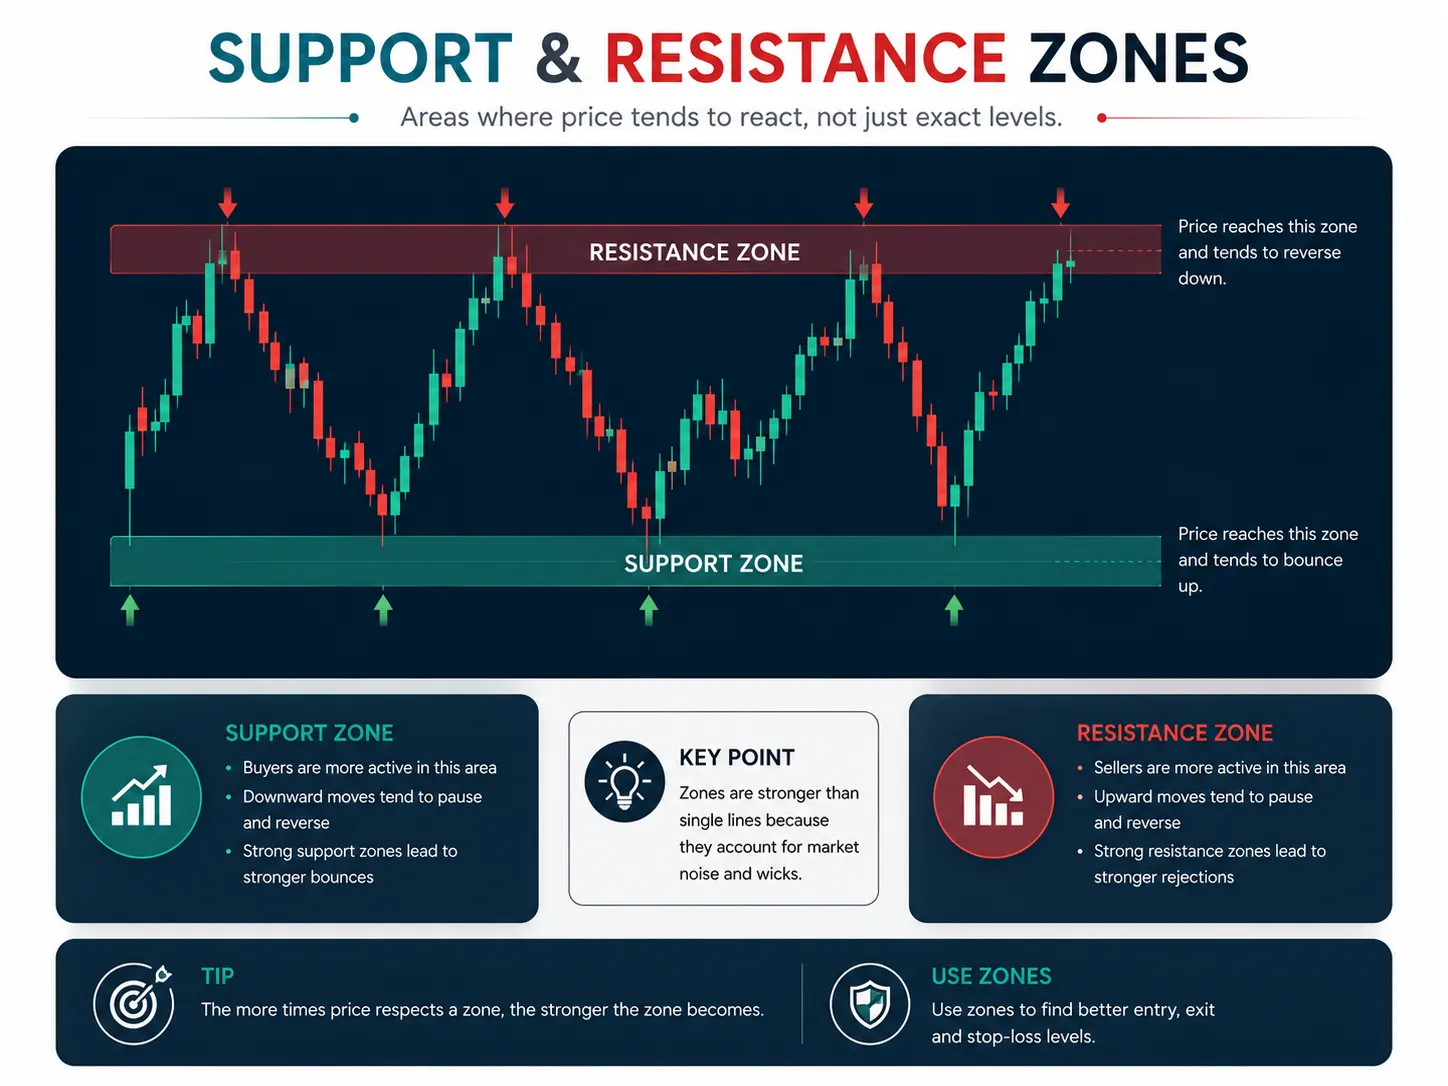
Support and Resistance as Zones
One of the most important support and resistance lessons is to avoid treating every level as a single exact price.
Markets move continuously. Different traders use different data feeds, time frames, chart settings, and execution methods. Price may react slightly above, below, or through a previously observed level before choosing direction.
Why zones are more practical
A support zone may run from ₹395 to ₹402 rather than sitting precisely at ₹400. A resistance zone may extend from ₹495 to ₹503 rather than being exactly ₹500.
Thinking in zones helps you:
- Avoid reacting to minor price noise.
- Assess whether price is genuinely holding or failing.
- Place stops based on invalidation rather than a visible line.
- Avoid entering only because price touched one number.
- Account for spread and slippage.
How to draw a zone
Start by identifying an area where price paused, reversed, or consolidated. Mark the cluster of relevant highs, lows, candle bodies, and wicks rather than forcing one narrow line.
Then ask:
- Did price react there more than once?
- Did the area lead to a meaningful move?
- Is it visible on a higher time frame?
- Is there increased volume or obvious market attention?
- Does the zone align with broader trend structure?
How to Identify Key Levels
A disciplined process makes support and resistance levels more useful than drawing many random horizontal lines.
Start with a higher time frame
Use a weekly or daily chart to identify broad market structure. Higher-time-frame levels are often watched by more participants and can provide stronger context than a single short-term candle.
Mark obvious swing points
Look left on the chart for places where price changed direction clearly. Prior highs and lows, range boundaries, and consolidation areas are natural starting points.
Look for repeated reactions
A zone that has produced several clear reactions may be more relevant than a zone touched once. Reactions do not need to be identical; market prices rarely reverse at the exact same point.
Consider volume and activity
A large move away from a zone accompanied by increased activity may make the area worth watching when price returns. Volume does not prove a level will hold, but it can add context.
Check the broader trend
A support zone in a strong downtrend may break more easily than one in a stable uptrend. Likewise, resistance in a strong uptrend may eventually be overcome.
Keep the chart clean
Too many levels create confusion. Mark only the zones that are obvious, relevant to your time frame, and connected to a possible trade plan.
Strong vs Weak Levels
Not every support and resistance area has the same relevance. Strength is not a fixed score, but several characteristics can help you evaluate a zone.
| Feature | Potentially stronger zone | Potentially weaker zone |
|---|---|---|
| Time frame | Visible on weekly or daily charts | Visible only on a very short time frame |
| Price reaction | Clear reversal or major consolidation | Minor pause with little follow-through |
| Number of reactions | Multiple meaningful reactions | One unclear touch |
| Volume and activity | Increased activity around the zone | Limited evidence of participation |
| Market context | Aligns with broad trend or major range | Fights strong broader momentum |
| Clarity | Easy to identify without forcing it | Requires excessive interpretation |
| Distance from current price | Relevant to current trade idea | Too distant to affect current decision |
A level that has been tested many times is not automatically stronger forever. Each test can absorb some buying or selling interest. Repeated support tests may eventually weaken the available demand, while repeated resistance tests may eventually reduce supply.
Breakouts and Breakdowns
A breakout happens when price moves above a recognised resistance zone. A breakdown happens when price moves below a recognised support zone.
What to look for in a breakout
Traders often evaluate:
- Whether price closes beyond the resistance zone.
- Whether the move has increased activity or volume.
- Whether the broader trend supports the breakout.
- Whether price can hold above the former resistance area.
- Whether there is enough distance to a logical target.
- Whether the stop-loss location creates reasonable risk.
A breakout can fail quickly. Price may move above resistance, trigger buying interest, and then reverse back into the range. This is often called a false breakout or failed breakout.
What to look for in a breakdown
A breakdown below support may show that sellers have gained control. However, a brief move below support can also reverse sharply if buyers step in and reclaim the area.
A trader should avoid assuming every break is valid. Waiting for confirmation, such as a close beyond the zone or a successful retest, can reduce impulsive entries. It may also mean missing some fast moves. That is a trade-off, not an error.
Risk reminder: Breakouts and breakdowns can fail. News, low liquidity, spread expansion, and stop-loss cascades can cause price to move beyond a level briefly before reversing. Define your invalidation level and position size before entering.
Role Reversal
Role reversal is the idea that a broken resistance zone may later act as support, while a broken support zone may later act as resistance.
Resistance becoming support
Suppose price breaks above a resistance zone near ₹500 and later pulls back toward it. If buyers step in around the former resistance area, traders may view that as a potential support confirmation.
Support becoming resistance
Suppose price falls below support near ₹400 and later rallies back toward it. If sellers appear around ₹400 and reject the rally, the former support may now act as resistance.
Role reversal is common enough to be useful as a concept, but it is not automatic. The retest may fail, the market may gap through the area, or broader trend conditions may dominate.
Using Multiple Time Frames
Multiple-time-frame analysis helps you place support and resistance within wider market context.
Higher time frame for direction
A daily or weekly chart can show whether the market is trending, ranging, or approaching a major long-term level.
Lower time frame for execution
A shorter chart can help traders identify a more precise entry, stop placement, or confirmation pattern. For example, a swing trader may identify daily support, then use a one-hour chart to wait for a reversal structure.
Avoid conflicting complexity
Do not use multiple time frames only to find a reason to take a trade. The goal is clarity.
A simple structure might be:
- Weekly chart: Identify major support and resistance zones.
- Daily chart: Assess trend and nearby price structure.
- Four-hour or one-hour chart: Plan a specific entry and invalidation.
- Lower time frame, if needed: Refine execution without overriding the broader plan.
NSE material describes a top-down approach that considers both long-term and short-term charts when analysing a stock.
Support and Resistance With Other Tools
Support and resistance work best as part of a larger process rather than as isolated lines.
Trend structure
A support zone that aligns with a broader uptrend may deserve closer attention than support that appears during a sustained downtrend. Trend does not guarantee success, but it provides context.
Volume
Increased volume near a level may show stronger participation. For example, a breakout with expanded activity may be more meaningful than one occurring in a quiet market. Still, volume can increase during failed moves too.
Moving averages
Some traders use moving averages as dynamic areas of interest. They should not be treated as exact barriers, and different settings can produce different readings.
Candlestick confirmation
A reversal candle, strong close, or rejection wick near a zone may help a trader define timing. One candle is not enough without context.
Risk-reward planning
A level is useful only if the potential trade offers a clear invalidation point and a reasonable distance to the next significant area. If the stop must be too wide or the next resistance is too close, the trade may not fit your plan.
Liquidity and spread
A well-marked level is less useful if the asset has poor liquidity, a wide bid-ask spread, or shallow order-book depth. Read What Is Liquidity in Trading? and Bid-Ask Spread Explained before trading low-volume instruments.
Practical Trade Examples
These examples are hypothetical and illustrate planning, not recommendations.
Example 1: Buying near support
A stock has been making higher highs and higher lows on the daily chart. It pulls back into a prior support zone between ₹780 and ₹790.
A trader may decide:
- Wait for price to show that the zone is holding.
- Look for a constructive reversal on a lower time frame.
- Define invalidation below the support zone.
- Calculate position size from entry-to-stop distance.
- Consider the next resistance zone when planning a target.
- Avoid the trade if upcoming results or news create unacceptable uncertainty.
The key is not buying simply because price touched support. The key is waiting for a defined setup and controlling the loss if the zone fails.
Example 2: Selling near resistance
An asset is in a broader downtrend and rallies toward a previous resistance zone. The rally loses momentum near the zone and fails to close above it.
Where permitted and appropriate for the instrument, a trader may consider a bearish setup only after defining entry, invalidation above resistance, position size, and a potential target near the next support zone.
If price breaks above resistance and holds, the bearish thesis is invalid. The trader should follow the planned exit rather than adding to a losing position.
Example 3: Trading a breakout retest
A stock breaks above a well-defined resistance zone, then returns to test the area. Instead of entering during the initial breakout, a trader waits to see whether the former resistance zone holds as support.
This approach can offer a clearer invalidation level. But it also has a cost: price may continue rising without retesting, leaving no entry. Missing a trade is often preferable to entering outside your plan.
Common Mistakes
Avoid these common support and resistance mistakes:
- Drawing levels at exact prices instead of broader zones.
- Marking so many lines that every price looks important.
- Buying automatically at support or shorting automatically at resistance.
- Ignoring the broader trend and market conditions.
- Treating one previous touch as conclusive evidence.
- Entering breakouts without considering volume, liquidity, or follow-through.
- Placing stops directly on obvious levels without room for normal volatility.
- Ignoring spread and slippage in low-liquidity assets.
- Increasing position size because a level “looks strong.”
- Holding a losing position after a level clearly fails.
- Using support and resistance without a defined risk-management plan.
Technical tools should be combined with risk management in trading, including position sizing, stop-loss planning, and daily loss limits.
Key Takeaways
- Support and resistance are price zones where buying or selling interest has previously influenced market movement.
- Support may slow or reverse a decline; resistance may slow or reverse an advance.
- The best approach is to treat support and resistance levels as zones, not exact and unbreakable lines.
- Higher-time-frame levels, repeated reactions, clear price structure, and volume context can make a zone more relevant.
- Breakouts, breakdowns, and role reversals are possibilities—not guaranteed outcomes.
- Use multiple time frames to combine broader market context with a more precise execution plan.
- Include trend, volume, liquidity, spread, position size, and stop-loss logic in every trade plan.
- A chart level cannot guarantee a trade outcome; risk control remains essential.
– Frequently Asked Questions (FAQs)
Support and resistance are price areas where buying or selling interest has previously affected price movement. Support is associated with potential demand, while resistance is associated with potential supply.
Start with higher time-frame charts, identify clear prior swing highs and lows, mark consolidation areas and range boundaries, and look for repeated reactions. Treat the result as a zone rather than an exact price.
Not always. Multiple reactions can make a zone more visible, but repeated tests may also absorb the available buying or selling interest. A level can eventually fail.
When price moves above resistance, it is called a breakout. The former resistance may later act as support, but this role reversal is not guaranteed. A breakout can also fail and return into the prior range.
Support and resistance can be useful, but using them alone is risky. Combine them with trend context, volume, liquidity, execution planning, position sizing, and stop-loss rules.
They can be used in crypto markets, but crypto liquidity, volatility, exchange conditions, and overnight trading can create fast moves and failed levels. Check market depth, spreads, position size, and platform risks carefully.