Stock Market Indices: A Beginner’s Guide to NIFTY, SENSEX and Index Basics

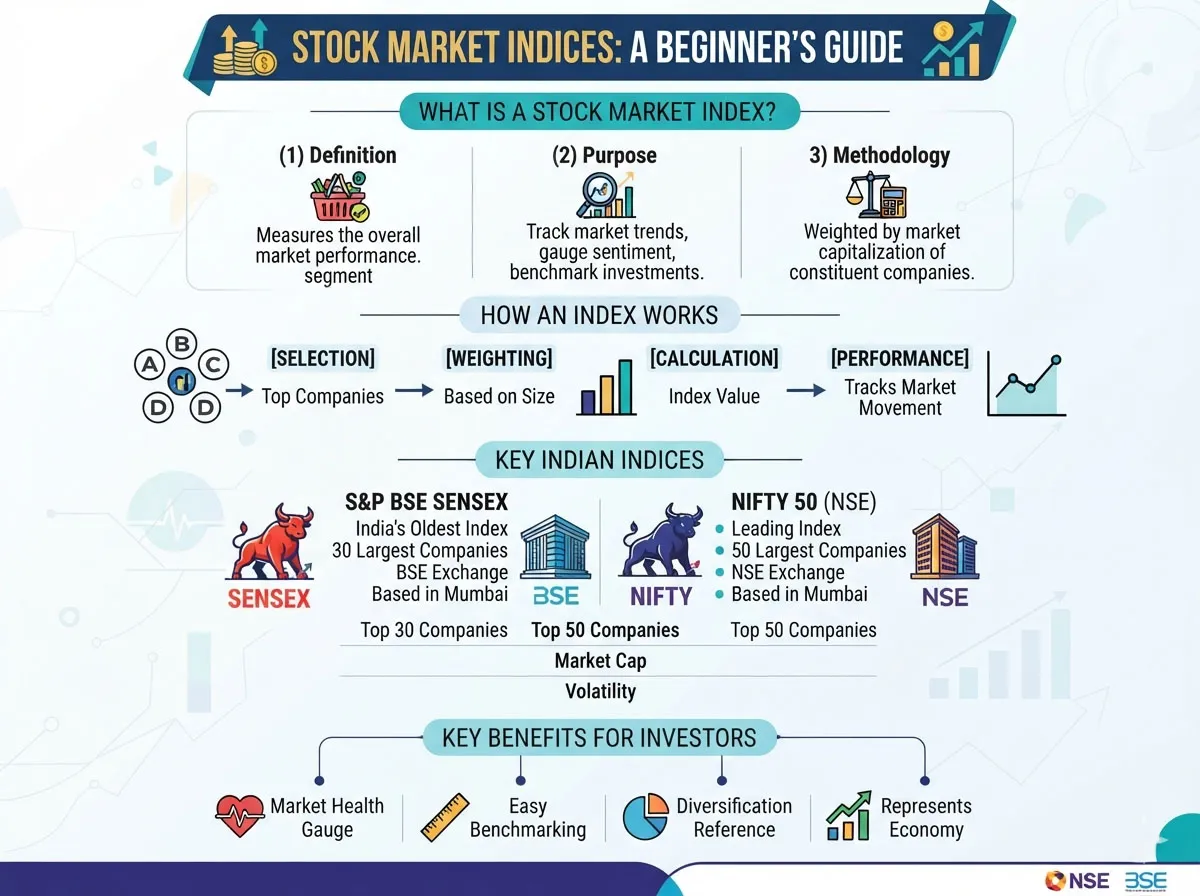
Stock market indices are tools that measure the performance of selected groups of securities. They help investors and traders see how parts of the market are moving without tracking every listed company individually.
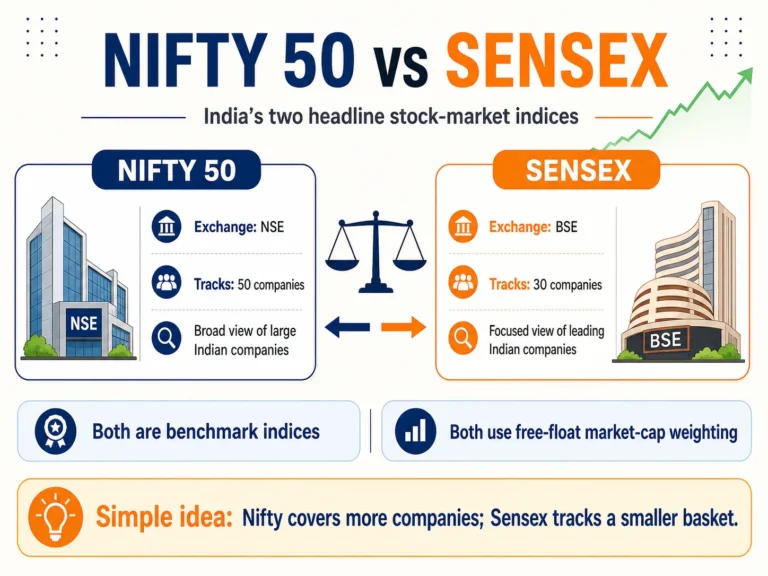
In India, NIFTY 50 and SENSEX are widely followed benchmark indices representing major companies listed on NSE and BSE. Both are calculated using a free-float market-capitalisation-weighted method, which focuses on shares available for public trading.
This guide explains stock market indices basics, with a focus on Indian indices and practical usage for beginners.
Education-only disclaimer: This article is for educational purposes only. It does not provide personalised investment advice, index-tracking recommendations, or a guarantee of returns. Stock market indices can rise or fall, and products linked to them involve risk.
What stock market indices are
Stock market indices are numerical measures representing the combined performance of selected securities. They are built from specific rules about which securities are included and how each is weighted.
Index composition
An index is defined by its constituents (the securities it includes) and by rules such as:
- Minimum market capitalisation.
- Liquidity criteria.
- Sector representation.
- Listing requirements.
These rules aim to make the index a meaningful representation of a segment of the market rather than a random list of companies.
Index level
An index level is calculated from the combined values of its constituents using the index’s methodology. It is a reference number, not a direct price of any single share.
If an index rises, it means that the weighted combination of its constituents has risen. Individual stocks inside the index may still have moved differently.
Why indices exist
Indices perform several roles in the market and in investor education.
Market barometers
Indices act as market barometers, showing whether a group of companies has generally risen or fallen over a period. For example, a rising broad index may indicate overall positive movement in large-cap stocks, while a falling index may suggest broad weakness.
SEBI’s market-index education material describes a securities-market index as a way to measure how the market is doing overall or in a specific area.
Benchmarks
Indices also serve as benchmarks. Fund managers and investors often compare the performance of portfolios against relevant indices to understand whether the portfolio has outperformed, matched or underperformed the wider market.
Product underlyings
Indices can be underlyings for products such as index funds, exchange-traded funds (ETFs) and derivatives. These products track, approximate or use index movement for their own structures. Understanding the index is therefore part of understanding those products.
Major Indian stock market indices
India has several indices, but two are particularly prominent: NIFTY 50 and SENSEX.
NIFTY 50
NIFTY 50 is a benchmark index of the National Stock Exchange (NSE). It represents 50 large, actively traded Indian companies across multiple sectors.
NIFTY 50 uses a free-float market-capitalisation-weighted methodology, meaning companies with larger free-float market caps have greater influence on index movement.
SENSEX
SENSEX (Sensitive Index) is a benchmark index of the Bombay Stock Exchange (BSE). It represents 30 major companies listed on BSE, selected based on criteria such as market capitalisation and liquidity.
Like NIFTY 50, SENSEX uses a free-float market-capitalisation method. It has a different base period and value, but the methodology for combining constituent values is similar.
Other indices
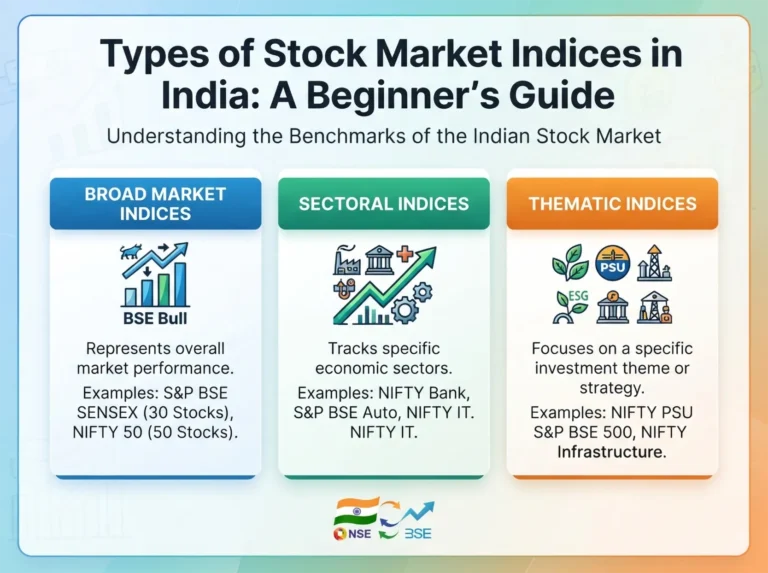
India also has sectoral indices, mid-cap and small-cap indices, and broader indices such as NIFTY Next 50 or NIFTY Midcap indices. Each aims to represent a particular segment or style of the market using defined rules.
How indices are constructed
Index providers follow specific methodologies when constructing indices.
Selection criteria
Companies are selected based on criteria that may include:
- Market capitalisation.
- Liquidity and trading frequency.
- Sector representation.
- Free-float levels.
These criteria help ensure that the index reflects meaningful market segments rather than infrequently traded or illiquid securities.
Weighting
Most major Indian indices use free-float market-capitalisation weighting. That means companies with higher free-float market caps carry larger index weights.
Other weighting methods exist globally (such as equal weighting or price weighting), but the free-float market-capitalisation method is common for broad Indian benchmarks.
Rebalancing
Indices are periodically reviewed and rebalanced. Companies may be added or removed based on changes in size, liquidity or other criteria. Rebalancing ensures that the index continues to reflect its intended market segment.
Free-float market capitalisation basics
Free-float market capitalisation is central to understanding many stock market indices.
What free float means
Free float refers to shares that are available for public trading. It excludes shares held by promoters, government entities, trusts or other holders whose shares are considered relatively less likely to trade in the open market.
Calculating free-float market capitalisation
A basic free-float market-capitalisation calculation is:
- Start with total outstanding shares.
- Subtract locked-in or restricted shares.
- Multiply the free-float share count by the current share price.
The result is free-float market capitalisation, which can then be used in index-calculation formulas.
How NIFTY 50 and SENSEX are calculated
Both NIFTY 50 and SENSEX use similar free-float market-capitalisation-weighted formulas.
General index formula
A common formula for these indices is:
- Index value = (Total free-float market capitalisation of constituents ÷ Base market capitalisation) × Base index value.
The base market capitalisation and base index value are set according to the index’s defined base period.
NIFTY 50 specifics
For NIFTY 50, the base period is November 3, 1995, and the base index value is 1,000. The free-float market capitalisation of the 50 constituent companies is combined and then divided by the base market capitalisation to calculate the current index level.
SENSEX specifics
For SENSEX, the base period is 1978–79 and the base index value is 100. The free-float market capitalisation of the 30 constituent companies is combined and divided by the base market capitalisation to determine the index level.
Practical interpretation
If the total free-float market capitalisation of index constituents rises, the index level tends to rise; if it falls, the index level tends to fall. However, sector shifts and individual company changes can make index behaviour more complex than a simple one-to-one mapping.
What indices do not tell you
Stock market indices are powerful summary tools, but they have limits.
Individual stock performance
An index showing a gain does not mean every company in the index gained. Some may have risen more than the index, others less, and some may have fallen.
Company fundamentals
Indices provide limited direct information about individual companies’ earnings, balance sheets, strategies or risks. Understanding fundamentals requires separate research.
Personal suitability
An index level does not indicate whether any specific investment or trading decision is suitable for an individual’s financial situation, goals or risk tolerance. Those considerations require personalised analysis and, where appropriate, professional advice.
Using indices as a beginner
Beginners can use stock market indices as reference points without treating them as signals to trade every movement.
Observing broad market direction
Indices can help show whether the broad large-cap market is trending up, down or sideways. This can provide context for understanding individual stock moves.
Comparing performance
Comparing the performance of a portfolio against a relevant index can help illustrate whether the portfolio is closely tracking the market, diverging from it, or behaving differently due to sector or style choices.
Avoiding overreaction
Short-term index moves can be noisy. Beginners benefit from avoiding overreaction to single-day changes and focusing on more meaningful trends, risk management and personal financial priorities.
Indices, index funds and derivatives
Indices underpin several types of products. Beginners should understand the basics before considering any product linked to an index.
Index funds and ETFs
Index funds and ETFs aim to track or approximate the performance of a target index. They do this by holding the underlying securities or using replication strategies.
While these products can simplify diversification for some investors, they still involve market risk, tracking error and product-specific considerations. Fees, liquidity and structure should be reviewed carefully.
Index derivatives
Futures and options on indices allow market participants to gain or hedge exposure to index movement without directly holding all constituent stocks.
These derivatives involve leverage and can magnify gains and losses. SEBI and other regulators emphasise that derivatives exposure can significantly increase risk and that participants should understand product mechanics, margins and potential losses.
Beginners should treat index derivatives as high-risk products and should not assume that understanding index basics alone is enough to manage derivative risk.
Risks related to indices
Indices themselves are measures, but decisions based on them can involve multiple types of risk.
Market risk
Indices can fall sharply during market stress, reflecting declines in constituent companies. Products that track indices may experience similar falls.
Concentration and sector risk
Even broad indices can have concentration in particular sectors or companies, depending on weighting methodology. A sector-specific index can be even more concentrated.
Derivatives and leverage risk
Using index derivatives without understanding leverage and margin can lead to significant losses, including losses exceeding initial capital. Regulators and investor-education sources warn about these risks.
Liquidity and tracking risk
Products that aim to track an index may face liquidity or tracking challenges. Over short periods, their returns may differ from the index due to costs, replication methods or market conditions.
Key takeaways
- Stock market indices measure the performance of selected groups of securities.
- Major Indian indices such as NIFTY 50 and SENSEX use free-float market-capitalisation weighting.
- Indices serve as market barometers, benchmarks and underlyings for index-linked products.
- Free-float market capitalisation focuses on shares available for public trading.
- Indices summarise broad movement but do not fully describe individual company fundamentals or personal suitability.
- Products linked to indices, especially derivatives, involve risk and require careful understanding.
– Frequently Asked Questions (FAQs)
There is no single “best” strategy for all beginners. A simple, risk-focused swing or trend strategy on liquid stocks, with clear rules and small position sizes, is often easier to learn than complex or highly leveraged approaches. This is an educational perspective, not a personalised recommendation.
No. Derivatives and leverage are not mandatory parts of stock trading strategies for beginners. They can increase risk and complexity. Beginners may focus first on understanding cash-market trading, risk and costs.
No. Markets involve uncertainty, and even well-designed strategies can experience losses or prolonged drawdowns. Risk management, discipline and realistic expectations are essential.
Risk per trade helps control the size of potential losses and keeps individual trades from damaging the account disproportionately. It is a key part of strategy design.
Official investor-education resources, such as SEBI’s materials on securities-market risk and safe investing, provide general guidance on types of risk and basic precautions.[web:66][web:2]