Moving Averages Explained: SMA, EMA and What They Actually Show


Moving averages turn a sequence of price observations into a smoother series. They can make the direction of recent prices easier to describe, but they do not reveal the next price or remove uncertainty. The calculation uses information already observed; a clean-looking line is not a promise that the market will continue along it.
The two versions most beginners meet are the simple moving average, or SMA, and the exponential moving average, or EMA. Their main difference is how they weight observations. Understanding that difference is more useful than memorising a supposedly perfect setting.
This guide explains the calculations, the meaning of a period, and the settings that can make two apparently identical indicators disagree. It is indicator education, not a crossover trading strategy. The cover’s curves are conceptual artwork, not calculated market data or a performance example.
Educational content only, not investment advice or a recommendation to trade. Examples are hypothetical. An indicator does not establish an advantage, limit losses or guarantee an executable price.
Table of Contents
What a moving average measures
A price-based moving average summarises selected observations across time. If the input is the closing price, it summarises closes. It does not automatically include each trade, the price paid by every investor, or the quantity traded at each price.
That distinction matters when someone calls it the market’s average purchase price. An ordinary SMA of daily closes is not a record of investors’ costs. Ten quiet sessions and ten highly active sessions contribute according to the formula, not according to how much money changed hands.
The line is called moving because the calculation updates as new observations arrive. Each plotted point represents the calculation at that point in the series. Connecting those values produces the familiar overlay on a price chart.
Before adding an overlay, understand the underlying display. Our guide to reading trading charts introduces the price, time and chart context that an indicator cannot replace.
How the simple moving average works
An N-period SMA adds the latest N selected observations and divides their total by N. Each included observation receives the same weight. When another period is added, the oldest observation in the window drops out.
For a five-period example, suppose the closing prices are 100, 102, 104, 106 and 108. Their sum is 520. Dividing by five gives an SMA of 104. These are hypothetical price units, not a quoted security.
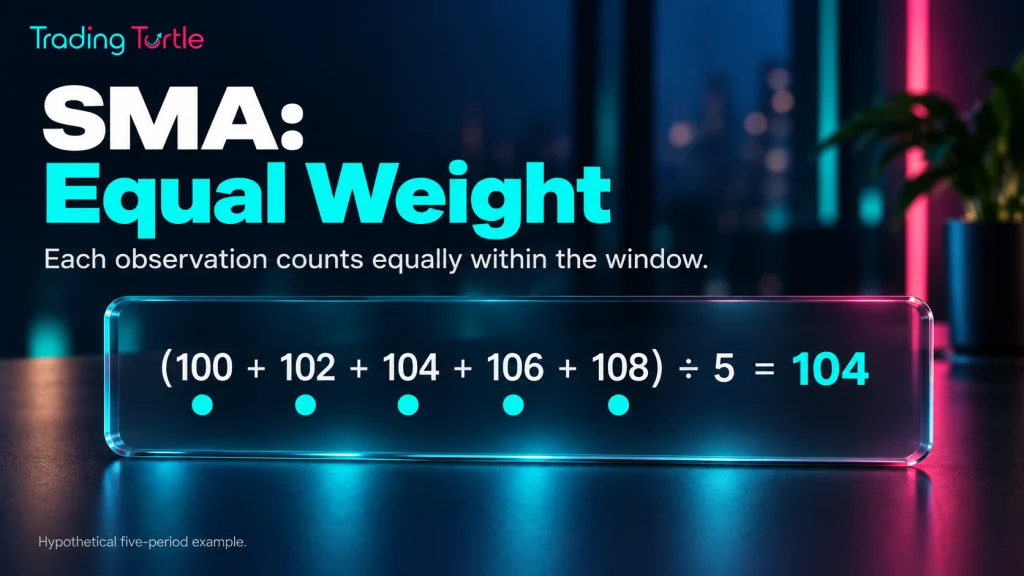
If the next close is 110, the new window is 102, 104, 106, 108 and 110. Its total is 530 and its SMA is 106. The new observation was included and 100 was removed; the calculation did not average all six closes.
Fidelity’s SMA indicator guide describes this equal-weight calculation. The examples here use a deliberately short window so the arithmetic can be checked without a spreadsheet.
Why an SMA can rise when the latest close falls
The change in an SMA depends on both the incoming observation and the one leaving the window. It is not determined solely by whether today’s close is above yesterday’s close.
Return to the first window: 100, 102, 104, 106 and 108, with an SMA of 104. If the next close is 107, the latest price has fallen from 108. Nevertheless, the new window totals 527 and its SMA is 105.4. It rises because the incoming 107 replaces 100.
This is a useful check against loose interpretations such as “the average went up, so the last price must have gone up.” The average describes a changing collection of observations. It does not duplicate the movement of the newest observation.
How the exponential moving average works
An EMA updates a previous average by combining it with the newest observation. Under the common convention, the smoothing factor is alpha, written α, and equals 2 ÷ (N + 1).
The update is: new EMA = α × current price + (1 − α) × previous EMA. An equivalent expression is previous EMA + α × (current price − previous EMA). Both expressions give the same result when the inputs and rounding are identical.
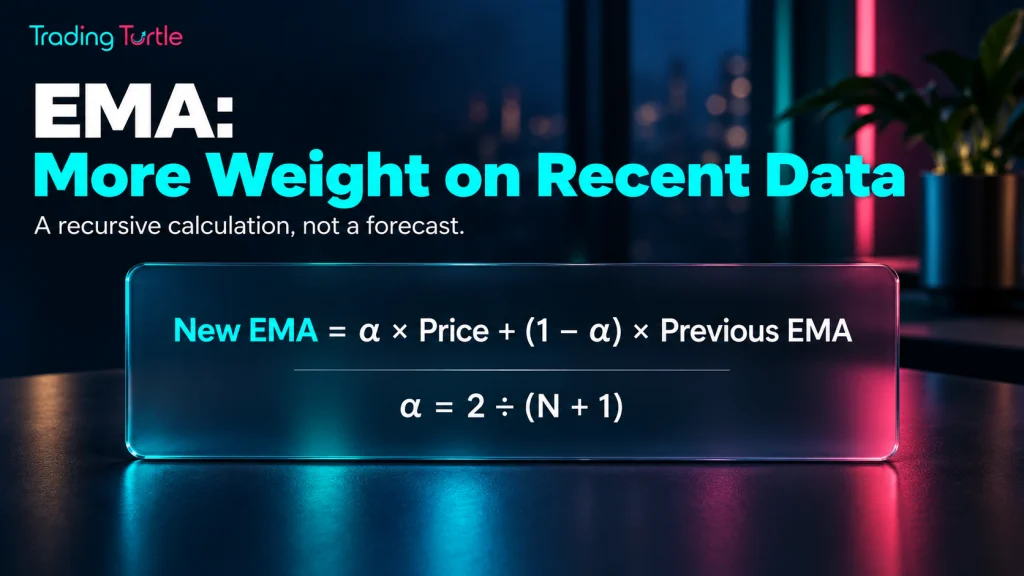
For N = 5, α is 2 ÷ 6, or one-third. If the previous EMA is 104 and the new close is 110, the updated value is one-third of 110 plus two-thirds of 104: 106. The earlier value of 104 is an explicitly assumed starting value for this illustration.
Fidelity’s EMA indicator guide explains the greater emphasis on recent observations. That emphasis changes responsiveness; it does not create knowledge about future prices.
The starting value still matters
An EMA needs an initial value. A platform might seed it from an initial SMA or follow another documented convention. Earlier history can therefore affect the displayed result, especially near the start of the available series.
Under the usual recursive calculation, older observations lose influence progressively rather than disappearing abruptly after exactly N bars. Calling a 20-period EMA “the average of only the last 20 prices” misses this feature.
If two platforms disagree slightly, investigate the starting history and rounding before assuming one is defective. A short manually calculated example will not necessarily reproduce a platform that has processed much more historical data.
SMA versus EMA: the useful comparison
Compare the two averages using the same source, timeframe and length. Otherwise, you may attribute a difference to the formula when the inputs are actually different.
| Question | SMA | EMA |
|---|---|---|
| How are observations weighted? | Equally inside a fixed window. | Recent observations receive greater weight under exponential decay. |
| What happens to older observations? | The oldest leaves when the window advances. | Earlier influence diminishes through the recursive calculation. |
| What is needed to start? | Enough observations for the specified window. | A starting value under the chosen implementation. |
| How does it respond? | Changes with both the new and outgoing observation. | Typically responds more quickly to recent changes at the same stated length. |
| Does it forecast the next price? | No. | No. |
“More responsive” is not a synonym for “more accurate.” An EMA can react earlier to a movement that soon reverses. A slower-looking line can reduce visible fluctuation while also delaying recognition of a change. Those are different behaviours, not a universal ranking of quality.
Nor must the EMA always sit above or below the SMA. Their relative position depends on the path of the data. In the five-period examples above, both can equal 106 under the stated conditions. Equal values at one point do not make the formulas identical.
A period is a bar, not automatically a day
A 20-period average on a daily chart uses daily observations. On an hourly chart it uses hourly observations; on a five-minute chart it uses five-minute observations. The number 20 alone does not identify the time horizon.

Twenty five-minute bars represent 100 minutes of bar intervals, but they do not necessarily represent the last 100 uninterrupted clock minutes. Session closures, missing bars and the platform’s construction rules can matter. A daily chart usually refers to trading sessions rather than every calendar date.
An indicator can also be configured to use a different timeframe from the visible chart. If you see a daily average overlaid on an intraday display, do not assume its length counts the visible intraday bars. Read the indicator’s settings and description.
Shorter and longer windows answer different questions
A shorter length places the summary closer to a smaller set of recent observations. A longer length smooths a broader history. Neither setting is meaningful without a purpose, the asset’s trading schedule and the interval being analysed.
For learning, keep one input fixed while changing another. Compare a five-period and a ten-period SMA on the same observations before switching formula, timeframe and source simultaneously. This makes the cause of a visual change easier to identify.
Avoid collecting many lines just because each has a familiar number. If you cannot explain what an additional average contributes to the description, it may add clutter rather than understanding.
Read the slope and price relationship carefully
A rising average means its calculated value is increasing across the points you compare. A falling average means the opposite. A nearly flat line means the values are changing little over that interval at the displayed scale.
Price above an average means the selected current price is greater than that average’s value. It does not mean the instrument is fairly valued, cheap, safe or certain to rise. Price below an average carries no automatic promise of a rebound or further decline.
Also distinguish the slope of the line from the distance between price and the line. Price can pull back while remaining above a rising average. An average can continue rising for a time after the latest price has weakened, as the earlier SMA example demonstrates.
Chart scaling affects appearance. Zooming or changing a price axis can make the same numerical slope look steeper or flatter. Compare values and time intervals when precision matters rather than judging an angle drawn on a screen.
Why a moving average is a lagging description
Both SMA and EMA are calculated from available observations. Smoothing reduces the prominence of some short-term changes, but it cannot report a change before the relevant input exists. An EMA’s greater responsiveness does not remove that limitation.
Imagine prices that remain near one level and then jump abruptly. A longer average will incorporate the new level alongside earlier observations, so it may remain far from the latest price. That gap reflects the construction of the indicator, not an obligation for price to return.
Do not interpret “lagging” as “always useless.” A summary can be useful for description precisely because it does not repeat every small movement. The mistake is asking a descriptive calculation to provide certainty about an unobserved outcome.
In sideways or rapidly reversing conditions, prices can cross an average repeatedly. Naming each crossing does not establish that trading each one would be profitable. Costs, execution and a complete testing method would be separate questions beyond this guide.
Check settings when two lines disagree
Before comparing screenshots, confirm the instrument and data feed. Similar symbols can refer to different listings or contracts. Then check average type, length, source, timeframe and any session restrictions.

The selected source may be close, open or a calculated combination of bar values. An average of closes and an average of typical prices answer different questions, even if both carry the same length label.
Historical adjustments can also alter inputs. A chart adjusted for a corporate action need not match one using a different adjustment setting. For derivative series, confirm the exact contract or continuous-series construction rather than assuming every similarly named chart has identical history.
Completed bars and forming bars
The current bar may still be developing. If an indicator uses that bar’s changing close, its latest value can change before the bar finishes. A screenshot taken halfway through a session can therefore differ from the completed historical view.
This does not automatically establish a software fault or deceptive indicator. Record whether the observation was intrabar or after completion. When reviewing a historical decision, compare information available at that moment, not a final value that became known later.
Read the documentation for your chosen indicator before changing its inputs. The exact options depend on the platform and implementation; this is not a claim that every application offers identical controls. Also check any visual offset: shifting a line forward or backward on the chart does not turn it into a forecast.
Common interpretations to avoid
First, do not treat an average as a guaranteed support or resistance level. Traders may observe reactions around widely watched values, but the calculation itself cannot prevent price passing through them. A line is not an order guaranteeing a particular exit.
Second, do not confuse an overlay with a complete decision process. It says nothing by itself about position size, available liquidity, financing or maximum loss. Our risk-management guide covers the broader questions an indicator cannot answer.
Third, do not optimise a setting by repeatedly inspecting the same historical outcome and then describe the chosen number as proven. A visually attractive fit can result from hindsight. This article does not nominate a universally best period for stocks, crypto or intraday trading.
Finally, keep execution separate from calculation. A moving-average value is not necessarily a price at which an order could have filled. The market-order and limit-order comparison explains why order instructions and available prices need their own checks.
A practical learning exercise
Write down ten hypothetical closing prices. Calculate the first five-period SMA, then advance the window one observation at a time. Keep the sum, the outgoing value and the incoming value visible so errors are easy to trace.
Next choose and record an EMA starting value. Apply the five-period smoothing factor to each new observation without rounding every intermediate step excessively. Compare the final displayed values only after applying a consistent rounding rule.
Now change one observation while leaving the others fixed. Notice how the SMA’s fixed window and the EMA’s recursive weighting distribute that change differently across later values. This is a calculation exercise, not a simulated return series.
If you repeat the exercise in charting software, write down the exact settings and available history. Explain any difference before adding more indicators. A reproducible calculation is a better learning milestone than a screenshot that merely looks convincing.
Frequently Asked Questions (FAQs)
Neither is universally better. EMA usually reacts more quickly to recent changes at the same stated length, while SMA uses equal weights within its window. Choose based on the descriptive question and understand the trade-off rather than treating speed as proof of profitability.
There is no universally best period. The timeframe, source, instrument and purpose all affect what a setting describes. A popular number is not evidence that it predicts future performance or suits a particular person.
Yes. In an SMA, a falling latest price can still replace a lower outgoing observation and raise the average. EMA behaviour depends on the new observation relative to the previous EMA, not only on its change from the preceding price.
Check the instrument, data feed, price source, timeframe, history, initialisation, sessions and rounding. Also compare completed bars rather than a forming bar on one platform and a final bar on another.
No. It describes a relationship between calculated series at a particular time. Whether that observation is useful for a trading rule requires separate definitions, risk controls and testing. This article intentionally does not prescribe a crossover strategy.