

Learning how to read trading charts becomes much easier once you stop trying to interpret everything at once. A chart can show price, time, volume, indicators, drawings and dozens of other data points, but a beginner does not need all of them to understand what the market has been doing.
The useful starting point is a repeatable reading order. First identify the timeframe. Then understand the price display, read the trend, mark important levels, check volume, and only after that consider indicators or patterns. This approach works across stocks, indices, futures, forex and crypto, although trading hours, liquidity, volatility and execution conditions differ between markets.
If you are learning how to read trading charts for the first time, think of a chart as a visual record rather than a prediction machine. It tells you what price has already done and helps you describe the current market structure. Your job is to interpret that information consistently, not to force the chart to confirm what you already want to believe.
How to Read Trading Charts in 7 Steps
The simplest way to learn how to read trading charts is to follow the same sequence every time you open one:
- Choose the market and timeframe. Know what instrument you are viewing and how much time each candle or bar represents.
- Read the price and time axes. Price normally runs vertically, while time runs from left to right.
- Identify the broader trend or range. Decide whether price is generally rising, falling or moving sideways.
- Mark meaningful support and resistance areas. Focus on obvious reaction zones rather than drawing lines everywhere.
- Check volume and participation. Ask whether important price moves are occurring with stronger or weaker activity.
- Add limited confirmation. A moving average, momentum indicator or candlestick pattern can add context, but should not replace price structure.
- Define risk before acting. If you are planning a trade, decide where the idea is invalid, how much you can risk and what execution risks may affect the position.
This seven-step routine is the foundation of how to read trading charts without turning a clean chart into a collection of conflicting signals.
What Does a Trading Chart Show?
At this stage of learning how to read trading charts, the goal is simply to understand what information the chart is displaying before interpreting it.
A trading chart is a visual representation of market data over time. The most important information is usually price, but many platforms can also display volume, indicators, order information and drawing tools.
When learning how to read trading charts, start with the two basic axes:
- Horizontal axis: time. The left side shows earlier market activity and the right side shows more recent activity.
- Vertical axis: price. Higher points represent higher quoted prices and lower points represent lower quoted prices.
The National Stock Exchange’s technical-analysis education material includes chart types, support and resistance, candlestick patterns, moving averages, indicators and risk management as connected parts of chart study. That is useful context because chart reading is not one isolated skill; it is a sequence of related observations.
You can review the broader concept in our guide to technical analysis, which explains how traders use price, volume, market structure, patterns and indicators as organised information rather than guaranteed signals.
Line Charts, Bar Charts and Candlestick Charts
Before learning how to read trading charts in detail, understand the three common chart formats you are likely to encounter.
Line chart
A line chart usually connects closing prices over a selected period. It is simple and useful when you want a quick view of direction, but it hides much of the price movement that happened inside each period.
For example, a daily line chart may show where a stock closed each day without showing how high or low it traded during the session. That makes line charts clean, but less detailed for active chart analysis.
Bar chart
A bar chart can display the open, high, low and close for each period. It provides more information than a line chart and can be useful for traders who prefer a compact price display.
Candlestick chart
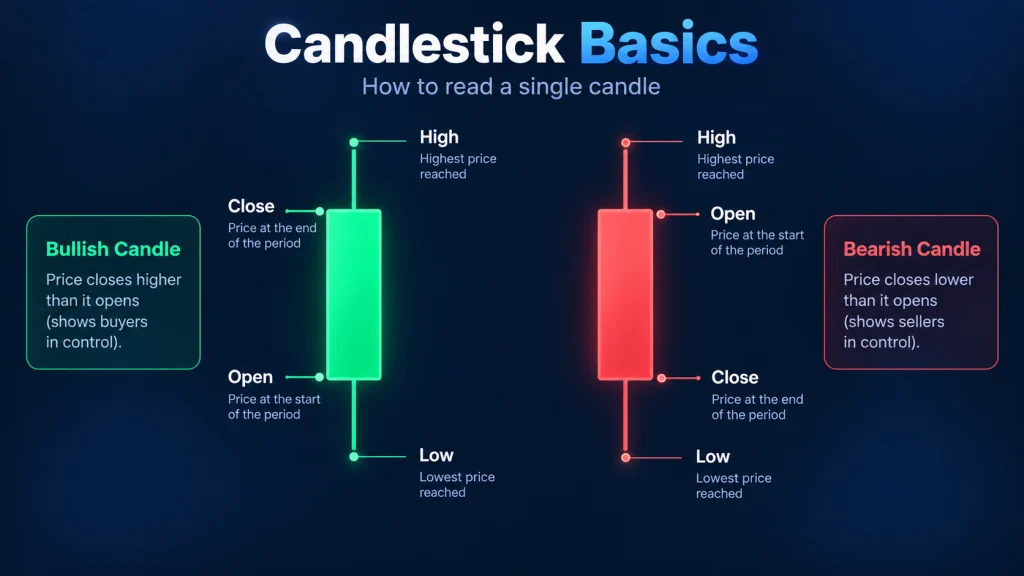
A candlestick chart also displays open, high, low and close data, but presents that information visually through a body and wicks. Candlesticks are widely used because they make it easier to see the relationship between the opening and closing price as well as the full trading range of each period.
If your main goal is how to read trading charts for technical analysis, candlestick charts are usually the most practical format to learn first. However, a candle should never be interpreted without considering the wider trend, nearby levels and the timeframe.
Our dedicated guide to candlestick patterns explains candle anatomy and common formations in more depth. This page keeps the focus on the broader chart-reading process.
How to Read a Candlestick on a Trading Chart
Every candlestick represents one selected period. On a five-minute chart, each candle represents five minutes of trading. On a one-hour chart, each candle represents one hour. On a daily chart, each candle normally represents one trading day.
Four prices matter:
- Open: the first traded price during the period.
- High: the highest traded price during the period.
- Low: the lowest traded price during the period.
- Close: the final traded price during the period.
The body shows the distance between the open and close. The upper and lower wicks show how far price travelled beyond the body before the period ended.
When learning how to read trading charts, do not stop at the colour of a candle. A large bullish candle near major resistance can mean something very different from the same candle after a long decline into support. Location matters.
Choose the Timeframe Before Reading the Chart
One of the most important lessons in how to read trading charts is that a chart has no useful context until you know the timeframe.
The same asset can look bullish on a 15-minute chart and bearish on a daily chart. That is not necessarily a contradiction. The shorter chart may be showing a temporary rally inside a much larger downtrend.
| Timeframe | What each candle represents | Typical use | Main limitation |
|---|---|---|---|
| 5 minute | Five minutes of activity | Short-term intraday detail | High noise and faster decisions |
| 15 minute | Fifteen minutes | Intraday structure | Can still overemphasise small moves |
| 1 hour | One hour | Intraday or short swing context | May hide larger daily structure |
| Daily | One trading day | Swing and broader trend analysis | Less detail for short-term entries |
| Weekly | One week | Longer-term market context | Too slow for precise intraday decisions |
Beginners learning how to read trading charts often benefit from starting with a daily chart because it contains less short-term noise than minute-based charts. You can then move to a lower timeframe when you have a specific reason to examine more detail.
Read the Trend Before Looking for a Setup
A common chart-reading mistake is to search immediately for a candlestick pattern or indicator signal without first asking what the broader market is doing.
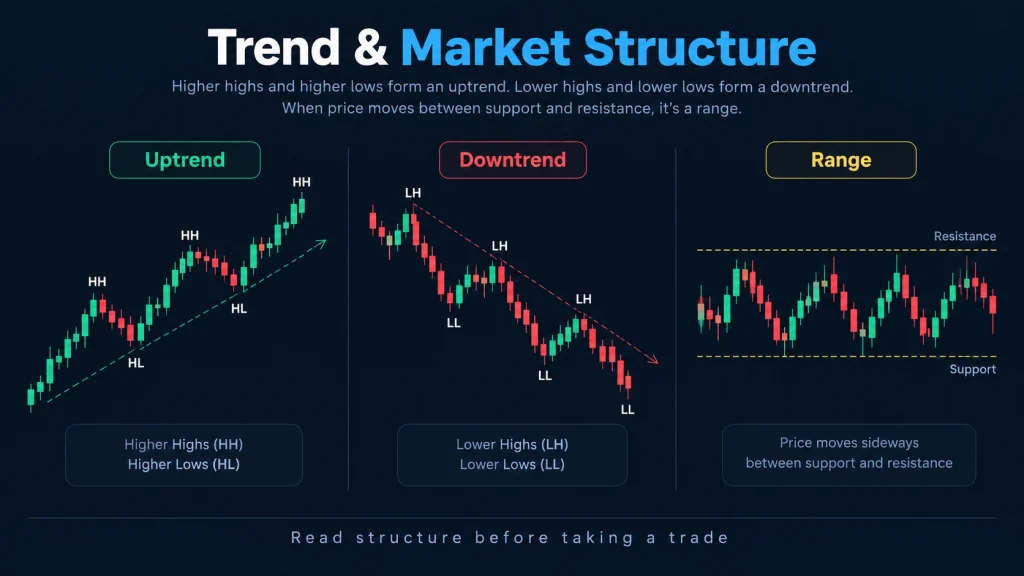
When learning how to read trading charts, classify the market into one of three broad conditions:
- Uptrend: price generally forms higher swing highs and higher swing lows.
- Downtrend: price generally forms lower swing highs and lower swing lows.
- Range: price moves broadly sideways between recurring areas of support and resistance.
An uptrend does not mean price rises on every candle. Pullbacks are normal. A downtrend can contain sharp rallies. A range can briefly break a boundary and then return inside it.
This is why how to read trading charts is mainly about context. One isolated price move is less useful than understanding where that move sits within the larger structure.
For a deeper explanation of higher highs, higher lows, lower highs and lower lows, read our guide to trends and market structure.
Mark Support and Resistance as Areas, Not Perfect Lines
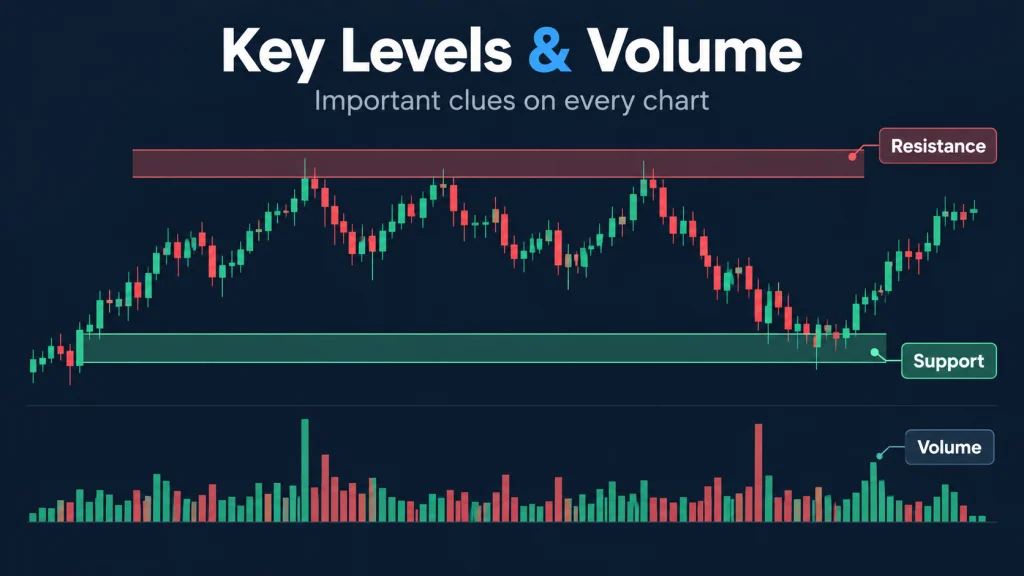
Support and resistance are areas where price has previously attracted enough buying or selling interest to slow, reverse or pause a move.
If you are practising how to read trading charts, start by looking left. Identify obvious prior swing highs, swing lows, range boundaries and zones where price reacted more than once.
A simple process is:
- Start on a higher timeframe such as daily or four-hour.
- Mark only clear reaction areas.
- Treat them as zones rather than exact prices.
- Check whether the level aligns with the broader trend.
- Remove levels that are no longer relevant to your current timeframe.
Too many horizontal lines make a chart harder to read. A beginner learning how to read trading charts should be able to explain why each marked area matters.
Our support and resistance guide explains how to identify and evaluate these zones in more detail.
Use Volume to Understand Participation
Another part of how to read trading charts is learning when market participation supports, weakens or complicates what price appears to be doing.
Volume measures how much of an instrument traded during a selected period. In stocks it commonly represents the number of shares traded. In other markets the exact volume measure can differ by venue and product.
Volume adds another layer when learning how to read trading charts because it helps you compare the strength of market participation behind different price moves.
For example:
- A breakout occurring with noticeably stronger volume may show greater participation than a similar breakout during very quiet trading.
- A sharp price move on weak participation may deserve more caution, especially in a thin market.
- A sudden volume spike can reflect news, forced exits, panic, enthusiasm or institutional activity. Volume alone does not tell you which explanation is correct.
Do not use the rule “high volume means the move must continue.” Markets can reverse after high-volume moves. Volume is supporting information, not a guarantee.
Understand Liquidity, Spread and Slippage Before Trusting the Chart
A chart can look clean while the actual instrument is difficult to trade. That is why how to read trading charts should include execution conditions, not just shapes on the screen.
Before acting on a chart, check whether the market has sufficient liquidity and whether the bid-ask spread is reasonable for your intended trade size. Thin liquidity can create wide spreads, sudden jumps and poor fills that are not obvious from a normal candlestick chart.
If these concepts are new, read our guides to liquidity in trading and the bid-ask spread. They explain why the displayed chart price is not always the price you will actually receive.
Use Indicators After You Understand Price Structure
Once the basic structure is clear, how to read trading charts can include indicators as a secondary layer rather than the starting point.
Indicators are calculations based on market data. Common examples include moving averages, Relative Strength Index (RSI), Bollinger Bands and momentum oscillators.
SEBI’s investor-education material describes technical analysis as the study of price movement, patterns and volume, and lists tools such as moving averages, RSI, Bollinger Bands and candlestick charts. That is a useful reminder that indicators are part of technical analysis, not a substitute for understanding the chart itself.
When learning how to read trading charts, keep indicators simple:
- Use a moving average to help visualise trend, not to declare that price must reverse at the line.
- Use a momentum indicator to compare current momentum with recent behaviour, not as an automatic buy or sell command.
- Avoid stacking several indicators that measure almost the same thing.
- Check whether an indicator adds information that you could not already see from price and volume.
A chart with six indicators can look more sophisticated while giving you less clarity. Better chart reading usually comes from understanding fewer tools more deeply.
How to Use Multiple Timeframes Without Confusing Yourself
Multi-timeframe analysis means examining the same market on more than one timeframe. It can improve context, but beginners often misuse it by changing timeframes until they find the answer they want.
A disciplined way to use multiple timeframes when learning how to read trading charts is:
- Higher timeframe: identify the broader trend, range and major levels.
- Trading timeframe: evaluate the setup you are actually considering.
- Lower timeframe: use only if it genuinely helps refine entry or execution.
For example, a swing trader might use the daily chart for context, the four-hour chart for structure and the one-hour chart for entry detail. The exact combination is not important. Consistency is.
The key lesson in how to read trading charts is to state the timeframe before stating the trend. “The market is bullish” is incomplete. “The daily chart is in an uptrend while the one-hour chart is pulling back” is much clearer.
A Practical Chart-Reading Example
The following example is hypothetical and is designed only to show the process of how to read trading charts.
Imagine a liquid stock trading near ₹500.
Step 1: Start with the daily chart
The daily chart shows a sequence of higher highs and higher lows over several weeks. That suggests an established uptrend, although the trend can still fail.
Step 2: Mark the nearest meaningful level
Price previously reacted several times between ₹470 and ₹475. Instead of drawing one perfect line, you mark that area as a support zone.
Step 3: Watch the pullback
The stock pulls back from ₹520 toward ₹478. Volume becomes quieter during the decline. That does not guarantee support will hold, but it tells you the pullback is occurring with less activity than the previous advance.
Step 4: Move to the four-hour chart
On the four-hour chart, price stabilises near the prior zone and forms several completed candles without making a decisive breakdown.
Step 5: Define confirmation and invalidation
Instead of assuming the support will hold, you decide what evidence would be needed before considering a trade and what price behaviour would invalidate the idea.
Step 6: Calculate risk before quantity
If a trade were planned, position size should be based on the distance between entry and invalidation, the account size and the maximum acceptable loss. Our position-sizing guide explains that calculation step by step.
This example shows why how to read trading charts is not about finding one magical candle. The conclusion comes from timeframe, structure, location, participation and risk taken together.
How to Read Stock Charts vs Crypto Charts
The basic principles of how to read trading charts apply to both stocks and crypto: price moves over time, trends form, levels matter, and volume can add context. But the markets are not identical.
| Factor | Stock charts | Crypto charts |
|---|---|---|
| Trading hours | Usually tied to exchange sessions | Many crypto markets trade 24/7 |
| Gaps | Can occur between sessions | Continuous trading reduces session gaps but does not remove sudden jumps |
| Volume | Exchange-reported volume is commonly available | Volume can vary significantly between exchanges and pairs |
| Volatility | Varies by stock and market condition | Can be especially high in smaller tokens and leveraged products |
| Market structure | Regulated exchange structure | Venue, product and jurisdiction can differ substantially |
If you are searching specifically for how to read stock charts, the chart-reading sequence on this page still applies. Just remember to include stock-specific context such as market hours, corporate results, index conditions and liquidity.
Common Mistakes When Reading Trading Charts
Most mistakes in how to read trading charts come from skipping context, changing the rules mid-analysis or treating one signal as certainty.
Understanding how to read trading charts also means knowing what not to do.
Labelling every small movement
If every candle becomes a swing high or swing low, market structure turns into noise. Start with obvious pivots relevant to your timeframe.
Changing timeframes until the chart agrees with you
This is sometimes called timeframe shopping. Decide your analysis timeframe before forming a conclusion.
Treating one breakout as proof
A break of support or resistance can fail. Price may briefly move beyond a level and then return. Wait for the confirmation rules required by your process.
Using too many indicators
More indicators do not automatically produce better analysis. Several indicators can give the illusion of confirmation while measuring similar price behaviour.
Ignoring liquidity and spread
A chart pattern can look attractive in an instrument that is expensive or difficult to enter and exit.
Reading incomplete candles as final signals
A candle can change significantly before its period closes. If your method uses completed candles, wait for the close.
Drawing levels after the move happened
It is easy to make a chart look perfect in hindsight. Mark important levels and conditions before the outcome whenever possible.
Forgetting risk management
Learning how to read trading charts does not remove the need for a stop plan, position sizing and realistic assumptions about slippage. A correct market read can still become a poor trade if the position is oversized.
A 30-Second Chart-Reading Checklist
Before drawing a conclusion from any chart, ask:
- What market and instrument am I viewing?
- What timeframe am I analysing?
- Is the broader structure bullish, bearish or ranging?
- Where are the last meaningful swing high and swing low?
- What support or resistance areas are relevant?
- What is volume doing around the current move?
- Is liquidity adequate and is the spread reasonable?
- Am I using an indicator because it adds context or because I want confirmation?
- What price behaviour would make my interpretation wrong?
- If I trade, how much capital is actually at risk?
This checklist turns how to read trading charts into a repeatable process rather than a guessing exercise.
What Trading Charts Cannot Tell You
A complete lesson in how to read trading charts also needs clear limits. Charts organise evidence; they do not remove uncertainty.
Charts are useful, but they have limits.
- They cannot guarantee that a support level will hold.
- They cannot guarantee that a breakout will continue.
- They cannot guarantee that a candlestick pattern will reverse price.
- They cannot guarantee that an indicator signal will be profitable.
- They cannot guarantee that a stop-loss will execute at the exact trigger price.
- They cannot guarantee that news or an unexpected event will not change market behaviour.
Learning how to read trading charts should make uncertainty easier to manage, not make you believe uncertainty has disappeared.
How to Practise Chart Reading Without Rushing Into Live Trades
A useful way to practise how to read trading charts is to separate analysis from money at first.
- Choose one liquid market.
- Use one higher timeframe and one trading timeframe.
- Mark the trend and two or three important levels.
- Write down what would confirm or invalidate your idea.
- Save a screenshot before the move develops.
- Review the chart later and compare the outcome with your original reasoning.
- Repeat the process instead of judging yourself on one result.
Paper trading can help you learn platform mechanics and practise a written process before risking real money, although simulated results do not reproduce every live-trading emotion or execution issue.
Once you begin planning trades, connect chart analysis with risk management, stop-loss planning and position sizing. Chart reading is only one part of a complete trading process.
Key Takeaways
- Learning how to read trading charts is easier when you use a fixed order instead of analysing everything at once.
- Start with the instrument, timeframe, price axis and chart type.
- Identify trend or range before looking for patterns or indicators.
- Mark support and resistance as meaningful areas, not perfect lines.
- Use volume, liquidity and spread to understand participation and execution conditions.
- Indicators should add context after you understand price structure.
- The same chart can look different on different timeframes, so always state the timeframe before stating the trend.
- Charts describe market behaviour; they do not guarantee future outcomes.
- Good chart analysis still requires predefined risk, suitable position size and an exit plan.
Frequently Asked Questions (FAQs)
Beginners can learn how to read trading charts by starting with the timeframe, then identifying the trend, marking support and resistance, checking volume and only then adding simple indicators or patterns. A fixed sequence reduces confusion and makes analysis easier to review.
Start by checking the stock symbol, timeframe, price axis and chart type. Then determine whether price is trending or ranging, mark obvious support and resistance, and review volume. Avoid adding many indicators before you can read basic price structure.
Candlestick charts are a practical starting point because each candle shows the open, high, low and close for a selected period. A daily timeframe can also be easier for beginners because it contains less short-term noise than very fast intraday charts.
The timeframe should come first. After that, identify the broader trend or range and the nearest meaningful support and resistance areas. Patterns and indicators make more sense once that context is clear.
No. Chart patterns describe recurring price structures, but they can fail, break in either direction or produce false signals. They should be treated as context within a broader trading and risk-management process, not as predictions.
There is no required number. A beginner is often better served by understanding price, trend, support, resistance and volume before adding indicators. If you use an indicator, choose one that adds information rather than duplicating several similar signals.
Yes, the basic process for how to read trading charts can be used across both markets. However, trading hours, volatility, liquidity, exchange structure and volume data can differ, so market-specific risks still need to be considered.