Risk-Reward Ratio in Trading: Formula, Examples and Limitations

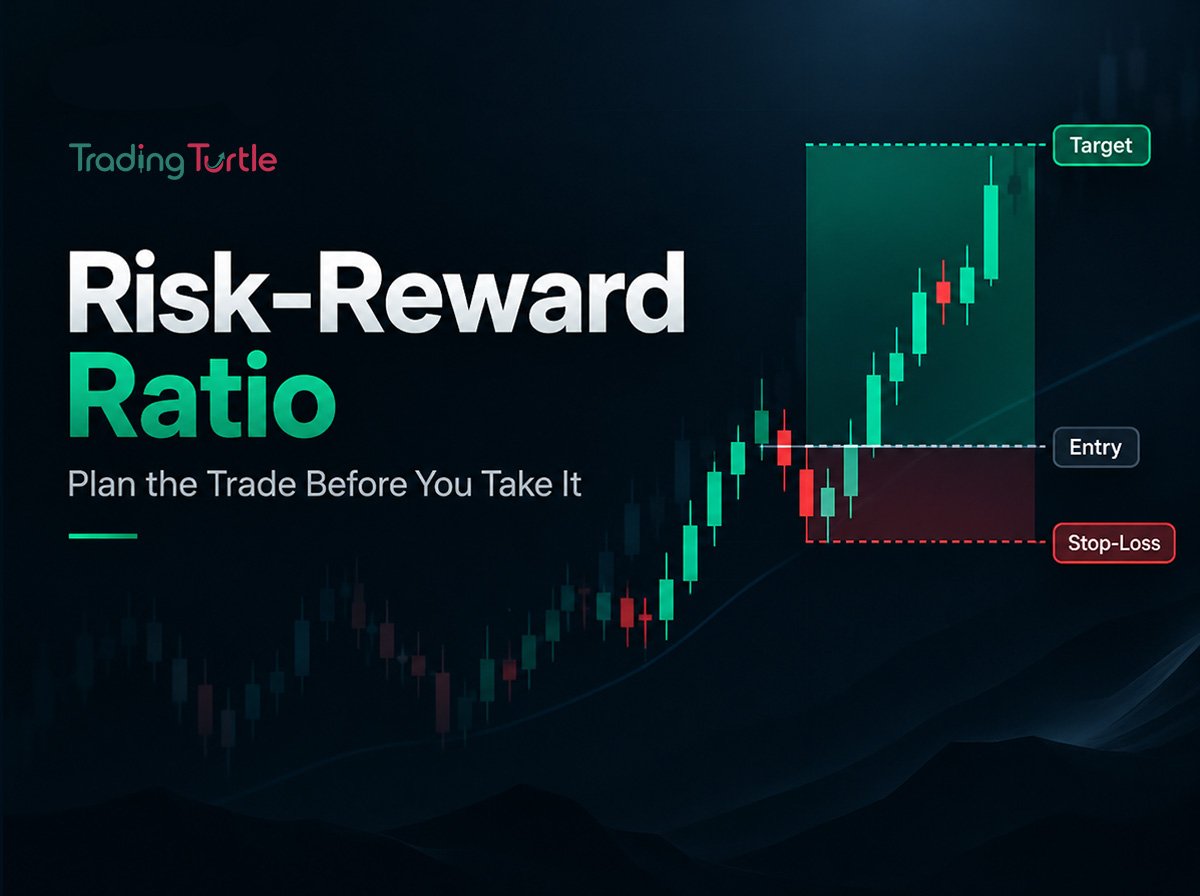
If the trade fails at my planned invalidation and succeeds at my planned target, how do those two distances compare?
The risk-reward ratio is one of the first numbers traders learn, but it is also one of the most misunderstood.
A setup described as “1:3” can sound attractive because the potential reward is three times the planned risk. Yet that ratio tells you nothing about how often the setup succeeds, whether the target is realistic, whether the stop is placed logically, or whether trading costs have been included.
Risk-reward ratio is useful when it answers a narrow question:
It should not be used to manufacture attractive trades by moving targets farther away or stops artificially closer.
Key Takeaways
- Risk-reward ratio compares planned potential reward with planned potential risk.
- A common convention expresses the relationship as risk:reward, such as 1:2 or 1:3.
- A higher reward multiple does not automatically mean a better strategy.
- Win rate, average win, average loss, costs and execution all affect long-run results.
- Stops and targets should come from a tested trading method, not from forcing a preferred ratio.
- Position size should be calculated from risk and stop distance, not from the attractiveness of the ratio.
- Realised results often differ from planned ratios because of early exits, partial profits, gaps and slippage.
Educational disclaimer: This article is for education only. Risk-reward calculations are planning tools, not forecasts or guarantees. Trading can result in losses, including losses larger than planned when markets gap or orders execute differently from expectation.
What Is Risk-Reward Ratio?
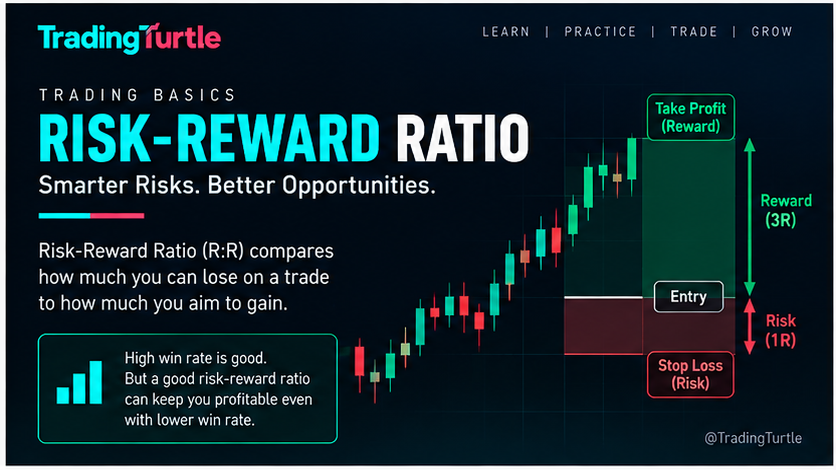
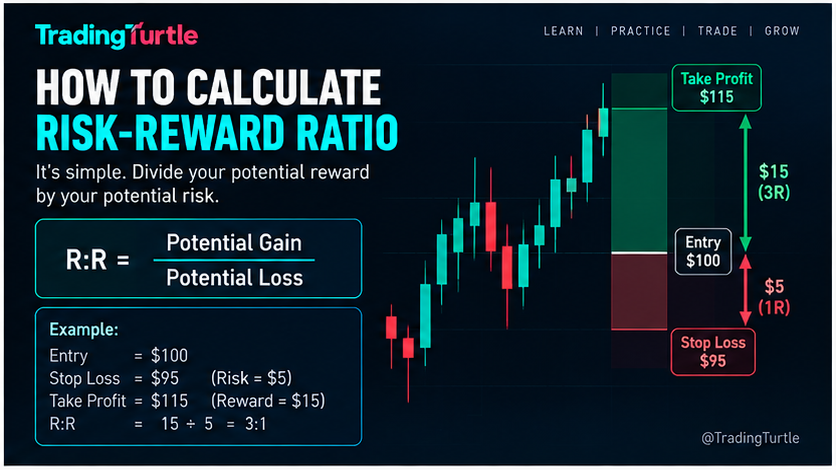
Risk-reward ratio compares the amount you plan to lose if a trade is invalidated with the amount you plan to gain if price reaches a defined objective.
Suppose you plan a trade with:
- entry: ₹500
- stop: ₹490
- target: ₹520
Planned risk per share is ₹10.
Planned reward per share is ₹20.
That can be described as 1:2 risk-to-reward: you are risking one unit to pursue two units of reward.
Some platforms reverse the order and display “reward/risk = 2.0.” Always check the convention being used.
Risk-Reward Ratio Formula
For a long position:
Risk per unit = Entry price − Stop price
Potential reward per unit = Target price − Entry price
Then:
Reward-to-risk multiple = Potential reward ÷ Potential risk
Using the example above:
- Risk = ₹500 − ₹490 = ₹10
- Reward = ₹520 − ₹500 = ₹20
- Reward/risk = ₹20 ÷ ₹10 = 2
This is commonly spoken of as a 1:2 risk-reward ratio.
For a short position, the direction changes:
- risk is the stop price above entry minus entry price;
- reward is entry price minus the lower target.
Example 1: A 1:1 Trade
Entry: ₹1,000
Stop: ₹980
Target: ₹1,020
Risk = ₹20
Reward = ₹20
Risk-reward = 1:1.
A 1:1 trade is not automatically poor. If a tested setup has a sufficiently high win rate and costs are controlled, it can still have positive expectancy.
Example 2: A 1:2 Trade
Entry: ₹1,000
Stop: ₹980
Target: ₹1,040
Risk = ₹20
Reward = ₹40
Risk-reward = 1:2.
This trade can lose more often than it wins and still potentially be profitable before costs if the average realised relationship remains close to the plan. But the word potentially matters. Real performance depends on actual results.
Example 3: A 1:4 Trade
Entry: ₹1,000
Stop: ₹990
Target: ₹1,040
Risk = ₹10
Reward = ₹40
Risk-reward = 1:4.
This looks excellent on paper. But ask whether a ₹10 stop is realistic for the instrument’s normal movement. If price regularly fluctuates ₹15–₹20 before moving in the expected direction, the stop may be so tight that the trade is repeatedly closed before the thesis has actually failed.
A high ratio created by an unrealistic stop is not good risk management.
Why Traders Use Risk-Reward Ratio
The ratio forces three decisions before the trade:
- where you plan to enter;
- where the setup is wrong;
- where a reasonable objective may exist.
That discipline is valuable because impulsive traders often think only about upside before entry and only about risk after the position moves against them.
A pre-defined ratio also makes trades easier to compare in a journal. A ₹2,000 loss in one instrument and ₹400 loss in another may represent the same planned risk if position sizes are different. Expressing results in multiples of risk helps normalise those differences.
Risk-Reward Ratio and Win Rate
Risk-reward ratio cannot be evaluated without win rate.
Imagine two hypothetical systems before costs.
System A
- Average win: 2R
- Average loss: 1R
- Win rate: 40%
Over 100 trades:
- 40 wins × 2R = +80R
- 60 losses × 1R = −60R
- Net = +20R before costs
System B
- Average win: 0.8R
- Average loss: 1R
- Win rate: 70%
Over 100 trades:
- 70 wins × 0.8R = +56R
- 30 losses × 1R = −30R
- Net = +26R before costs
System B has a smaller average reward relative to risk but a much higher win rate. It produces the better simplified result in this example.
The lesson is simple: there is no universal “best” risk-reward ratio.
Breakeven Win Rate
You can estimate the win rate required to break even before costs for a fixed reward-to-risk ratio.
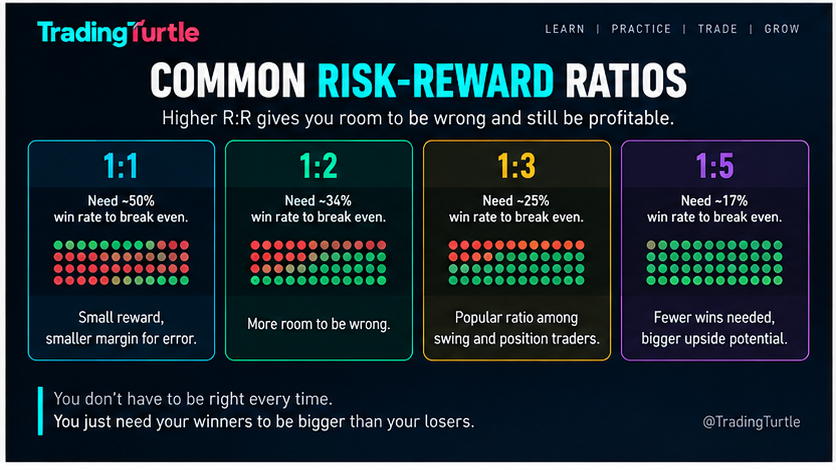
For a 1:1 setup, the theoretical breakeven win rate is 50%.
For a 1:2 setup, it is roughly 33.3%.
For a 1:3 setup, it is 25%.
These figures assume:
- every winner reaches the full planned target;
- every loser loses exactly 1R;
- no fees, spreads or slippage;
- no partial exits;
- no missed trades;
- no gaps beyond the stop.
Real trading rarely behaves that cleanly. The practical breakeven rate is normally higher once friction is included.
Expectancy: The Number Behind the Ratio
A more complete concept is expectancy.
A simplified formula is:
Expectancy = (Win rate × Average win) − (Loss rate × Average loss)
Suppose:
- win rate = 45%
- average win = 1.8R
- loss rate = 55%
- average loss = 1R
Expectancy = (0.45 × 1.8) − (0.55 × 1)
= 0.81 − 0.55
= +0.26R per trade before costs.
Expectancy is still based on historical or simulated data. It can change as markets change, and past results do not guarantee future outcomes. But it is more informative than saying “I only take 1:3 trades.”
Planned Ratio vs Realised Ratio
A planned 1:3 trade may not finish at +3R or −1R.
You may:
- exit early at +1.4R;
- scale out part of the position;
- trail the stop;
- experience slippage on the stop;
- close manually before invalidation;
- hold through a gap and lose 1.3R;
- miss the planned entry and enter at a worse price.
Your journal should therefore record both:
- planned R:R;
- realised R result.
Over time, the difference can expose behaviour problems. For example, if you repeatedly plan 1:2 trades but take profits at 0.5R while still allowing full 1R losses, your actual expectancy can be very different from the strategy you think you are trading.
How Risk-Reward Connects to Position Sizing
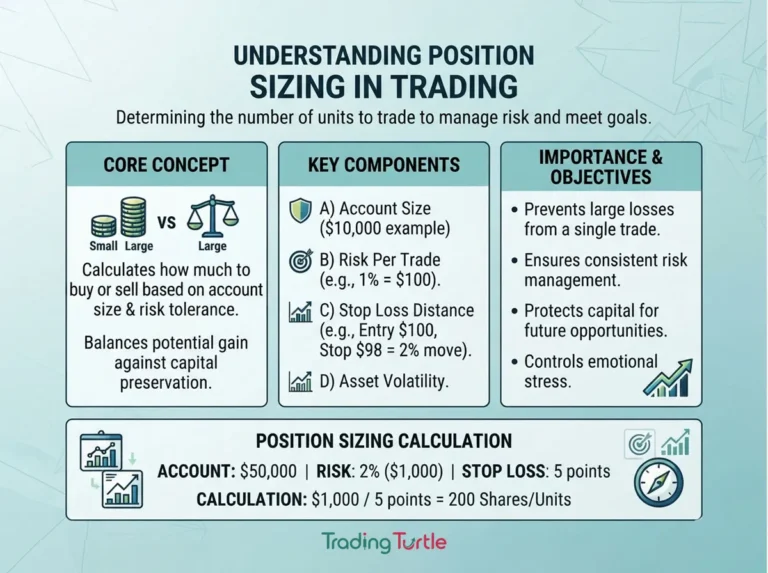
Risk-reward ratio tells you the geometry of the trade. It does not tell you how many shares or contracts to trade.
Position size should come from the maximum amount of capital you are willing to risk and the distance between entry and invalidation.
Suppose:
- trading capital: ₹2,00,000
- maximum planned risk: 0.5% = ₹1,000
- entry: ₹500
- stop: ₹490
- risk per share: ₹10
Simplified position size = ₹1,000 ÷ ₹10 = 100 shares, before accounting for costs, gaps and product constraints.
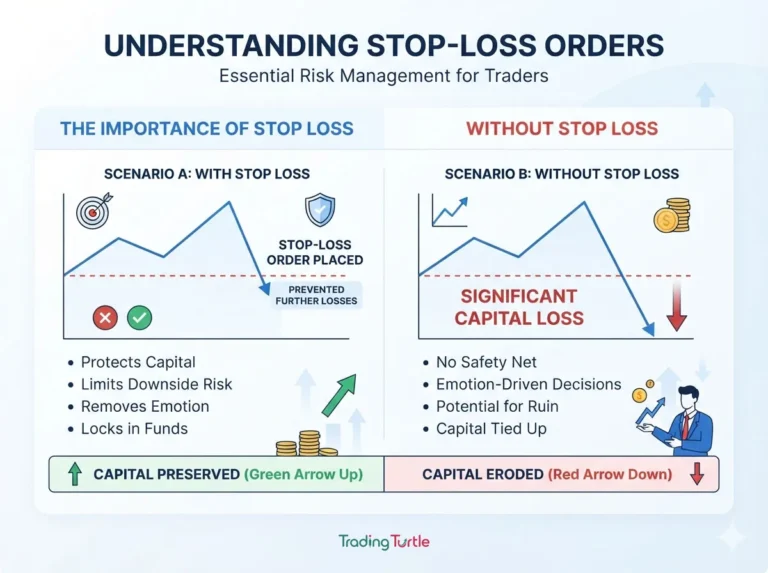
Now suppose the target is ₹520. The setup has a planned 1:2 ratio, but the money at risk remains ₹1,000 because position size was calculated from the stop distance.
Read Position Sizing in Trading for the full method.
Where Should the Stop Come From?
The stop should represent a level or condition that invalidates the trade under your method.
It should not be placed at an arbitrary distance just to produce a preferred ratio.
For example, if a swing-trading setup is invalid only below ₹480, using a stop at ₹495 because it gives you 1:4 instead of 1:2 can make the ratio look better while making the trade logic worse.
A sensible order of operations is:
- identify the setup;
- define invalidation;
- calculate stop distance;
- size the position from maximum risk;
- identify realistic objectives;
- evaluate whether the resulting reward potential is acceptable.
If the ratio is poor, skipping the trade can be better than manipulating the stop or target.
Where Should the Target Come From?
Targets can be based on different tested methods:
- previous support or resistance;
- measured range or volatility process;
- trailing structure;
- fixed R multiples;
- time-based exit;
- strategy-specific rules.
The key is realism.
If the next major resistance is only 1R away, setting a 4R target beyond several unbroken levels simply to meet a “minimum 1:4” rule may not be sensible.
Risk-reward ratio is a filter, not a reason to ignore the chart.
Risk-Reward and Trading Costs
Consider a short-term strategy targeting 1R where one R is small.
If the gross potential reward is ₹1,000 but typical total friction—brokerage, taxes, spread and slippage—amounts to ₹150, the net reward is lower.
The same ₹150 cost also makes losses slightly larger.
Frequent traders should calculate performance after costs. A setup that breaks even before costs loses money after costs.
Our guide to slippage in trading explains the execution component.

Risk-Reward Ratio in Different Trading Styles
Scalping
Targets are small, so spread and slippage can dominate. High theoretical ratios may be difficult to realise because price must move multiple times the stop distance within a short window.
Intraday trading
Time constraints matter. A target that is statistically possible over several days may be unrealistic before the market closes.
Swing trading
Wider stops and longer holding periods can allow larger price moves, but overnight gaps add risk.
Crypto futures traders should also account for volatility and leverage, which can amplify losses as well as gains. The CFTC’s virtual currency trading risk advisory explains these additional risks.
Position trading
Targets may be broad and stops may be far away, so position size becomes especially important.
The ratio should fit the strategy’s natural price behaviour.
Common Risk-Reward Mistakes
Mistake 1: Thinking 1:3 is always better than 1:2
A 1:3 setup with a 15% win rate can be worse than a 1:1.5 setup with a strong, stable win rate.
Mistake 2: Making the stop unrealistically tight
A smaller stop mechanically increases the displayed ratio but can make normal market noise stop you out.
Mistake 3: Choosing fantasy targets
A target is useful only if it has a reasonable basis in the strategy and market structure.
Mistake 4: Ignoring costs
Spread, slippage, fees and taxes reduce realised reward and can increase realised loss.
Mistake 5: Changing the target emotionally
Moving a target farther away after entry can turn a planned process into hope.
Mistake 6: Taking profits too early but keeping full losses
This is one of the fastest ways to destroy the expectancy implied by the original ratio.
Mistake 7: Increasing size on “high R:R” trades
A ratio does not measure certainty. A 1:5 setup can still lose.
A Better Pre-Trade Framework
Before entering, write down:
- entry condition;
- invalidation level;
- stop distance;
- maximum account risk;
- position size;
- first realistic objective;
- planned risk-reward ratio;
- expected costs;
- conditions for early exit;
- conditions for trailing or partial profit, if your tested plan uses them.
Then ask a final question:
Would I still take this trade if I knew the next outcome was a loss, but the setup followed my tested rules?
If the answer is no, you may be reacting to the potential reward rather than following a process.
Using a Trade Planner
A trade planner can make the calculation consistent. Enter the proposed entry, stop and target, then calculate the risk distance, reward distance and ratio before deciding position size.
Trading Turtle’s Trade Planner and Position Size Calculator are designed to support that workflow. The tool should not decide whether a trade is good; it should make the numbers visible before capital is committed.
Final Takeaway
Risk-reward ratio is valuable because it forces you to compare downside and upside before entering a trade.
Its weakness is that the number is easy to manipulate. Move the stop closer, move the target farther away, and almost any chart can be made to show a beautiful ratio.
Use it in the correct order: define the setup, identify invalidation, size the position from acceptable risk, choose a realistic objective, and then calculate the ratio. Review win rate and realised R results over a meaningful sample.
A sustainable strategy is not the one with the biggest number beside “reward.” It is the one whose risk, reward and probability work together after real-world costs.
Frequently Asked Questions (FAQs)
There is no universal good ratio. It depends on the strategy’s win rate, average realised win and loss, costs, market behaviour and execution. A lower ratio can work with a higher win rate, while a higher ratio can tolerate a lower win rate.
Not automatically. A 1:2 setup offers twice the planned reward per unit of risk, but it may reach the target less often. Judge the complete strategy, not the ratio alone.
Potentially, if average winners are sufficiently larger than average losers after costs. A 40% win rate with 2R average wins and 1R average losses has positive simplified expectancy before costs.
Do not move a stop solely to improve the displayed ratio. The stop should reflect where the setup becomes invalid under your tested method.
The basic chart calculation usually does not. A realistic performance review should include brokerage, taxes, spread, slippage and other trading costs.
R is a unit representing planned risk. If you risk ₹1,000 on a trade, 1R equals ₹1,000. A +2R result is ₹2,000 before costs; a −0.5R result is a ₹500 loss.