Market Structure Trading: How to Read HH, HL, LH and LL

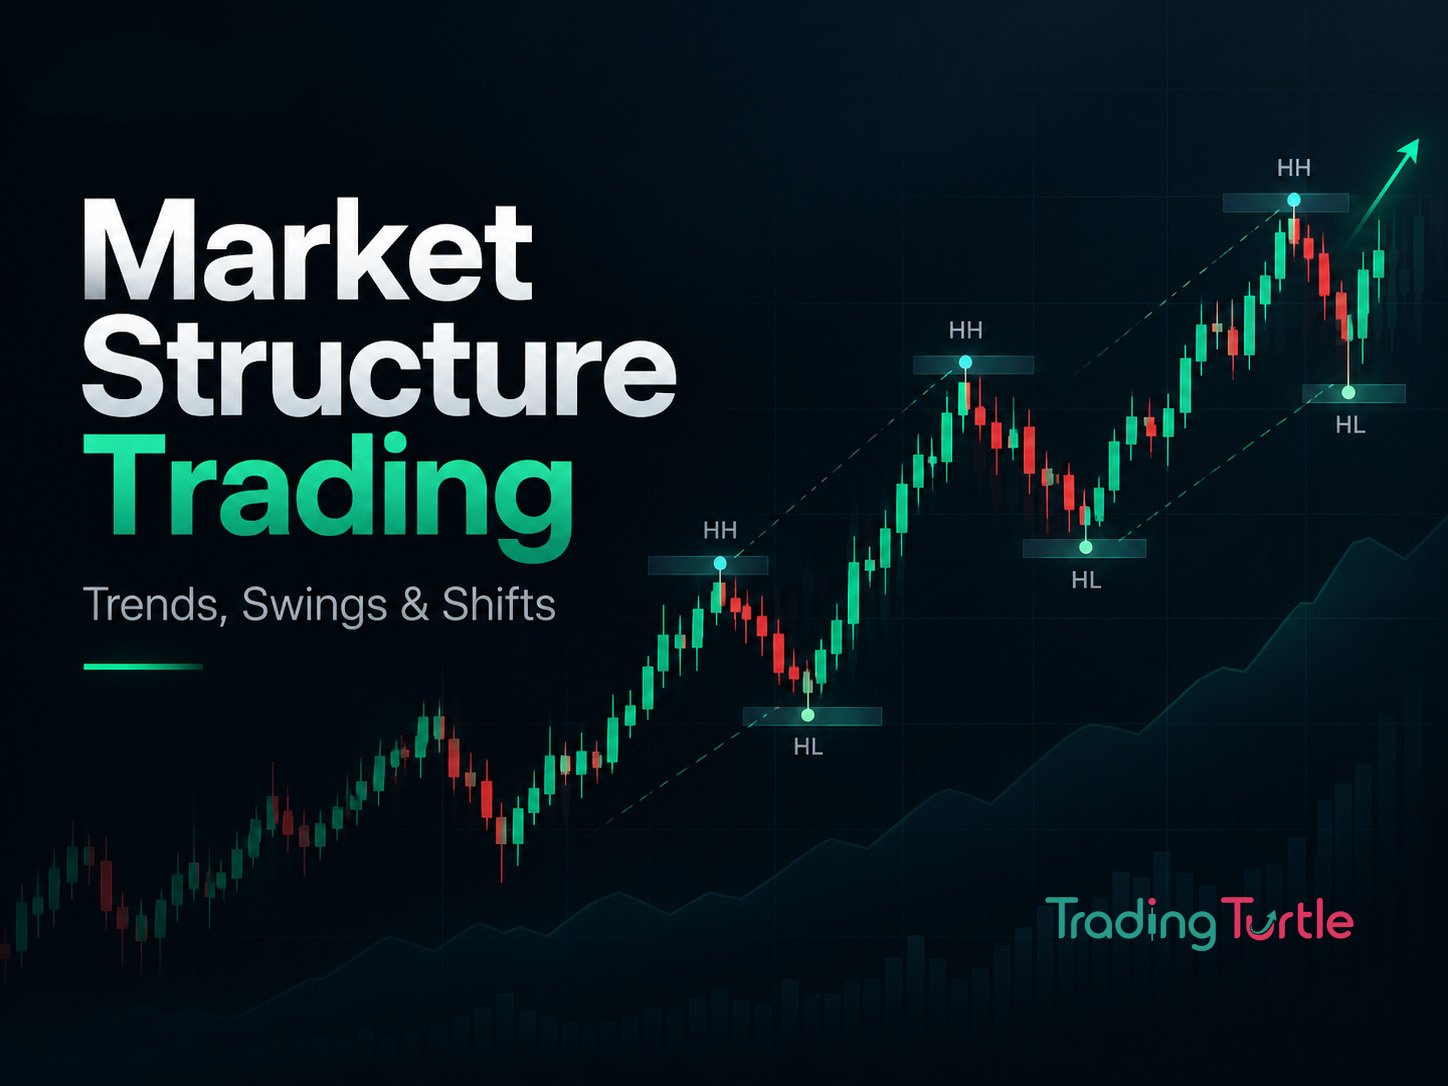
Market structure trading sounds complicated because traders often use abbreviations such as HH, HL, LH and LL without explaining what makes a swing meaningful or how those labels change when the timeframe changes.
The underlying idea is simple: price does not move in a straight line. It advances, pulls back, rallies and declines. The sequence of those swings can help you describe whether buyers or sellers have been controlling the broader move.
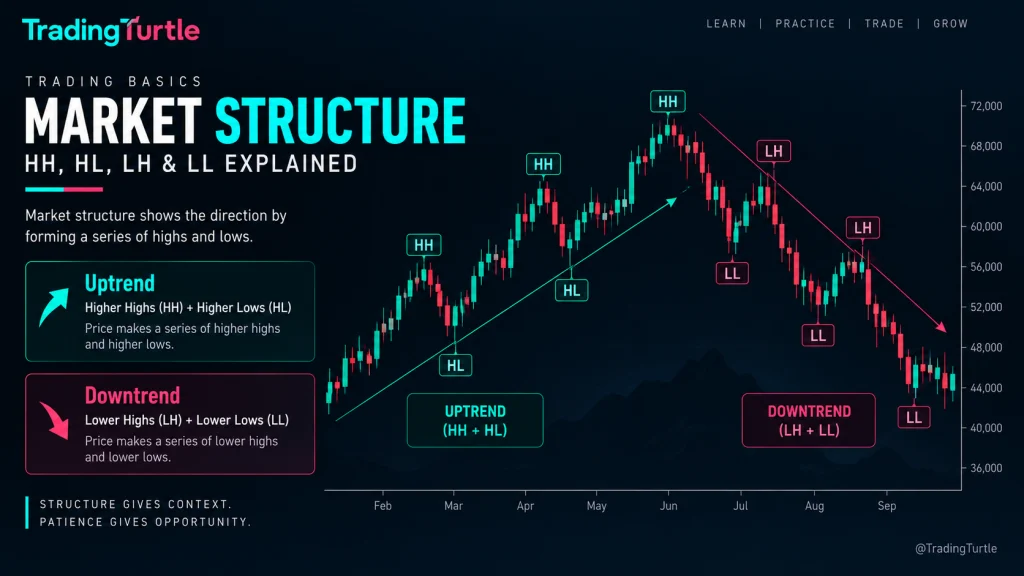
- HH: higher high
- HL: higher low
- LH: lower high
- LL: lower low
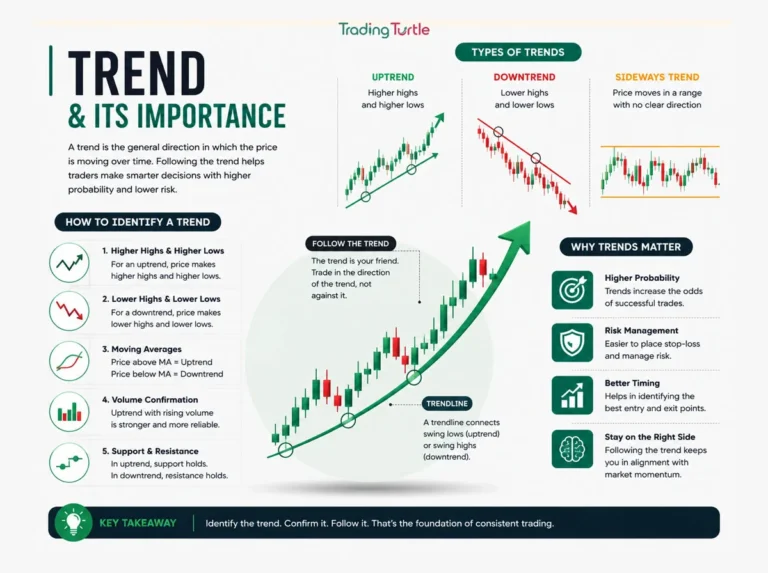
An uptrend often develops through higher highs and higher lows. A downtrend often develops through lower highs and lower lows. A range forms when neither side can maintain that sequence.
The value of market structure is not that it tells you what the next candle must do. It gives you a framework for saying, “This is the current behaviour, and this is the price area that would force me to reassess it.”
Educational disclaimer: This article is educational only. Market structure is a way to organise price information, not a prediction tool or guarantee of profit. Trading involves risk.
Key Takeaways
- Market structure trading describes price through meaningful swings rather than individual candles.
- Higher highs and higher lows are associated with an uptrend; lower highs and lower lows are associated with a downtrend.
- One broken swing does not automatically prove a full trend reversal.
- Structure depends on timeframe. A daily uptrend can contain a one-hour downtrend.
- The last meaningful swing often provides a useful invalidation reference.
- Support, resistance and liquidity context help interpret a structure break.
- Avoid labelling every small fluctuation; start with obvious pivots.
What Is Market Structure in Trading?
Market structure is the arrangement of swing highs and swing lows created as price moves over time.
Suppose a stock rises from ₹100 to ₹120, pulls back to ₹110, rises to ₹130, then pulls back to ₹118.
In a simplified reading:
- ₹120 is a swing high;
- ₹110 is a swing low;
- ₹130 is a higher high because it is above ₹120;
- ₹118 is a higher low because it is above ₹110.
That sequence suggests an uptrend on the timeframe being analysed.
If price later rallies only to ₹125 and then falls below ₹110, the sequence changes. You may now be looking at a lower high followed by a lower low, which can be evidence that the prior bullish structure has weakened or reversed.
The exact interpretation depends on your definitions and timeframe. The important thing is that the rules remain consistent.
HH, HL, LH and LL Explained
Higher High — HH
A higher high forms when a meaningful price peak exceeds the previous meaningful swing high.
If price previously peaked at ₹500 and a later advance reaches ₹530 before turning lower, ₹530 can be labelled a higher high.
A higher high shows that buyers were able to push price beyond the previous peak. It does not guarantee they will continue doing so.
Higher Low — HL
A higher low forms when a pullback stops above the previous meaningful swing low.
Suppose price rises to ₹530, pulls back, and buyers step in around ₹490 while the prior swing low was ₹470. The new low is higher than the previous one.
Higher lows are important because they show where the uptrend is being defended.
Lower High — LH
A lower high forms when a rally fails below the previous meaningful swing high.
In a downtrend, price may fall from ₹500 to ₹450, rally to ₹475, then resume lower. If the prior meaningful peak was ₹500, ₹475 is a lower high.
Lower Low — LL
A lower low forms when price falls below the previous meaningful swing low.
If the prior low was ₹450 and the next decline reaches ₹420, the new low is lower.
A sequence of lower highs and lower lows describes a downtrend on the chosen timeframe.
How an Uptrend Is Built
A textbook bullish sequence looks like:
HL → HH → HL → HH
But real charts are messier. Price may pause, form equal highs, briefly sweep below a prior low or spend days consolidating before continuing.
The practical question is not whether every swing is perfect. Ask whether the important pivots still show buyers making progress while pullbacks remain above earlier lows.
Read what a trend means in trading for the broader trend framework. Market structure adds more precision by identifying the individual pivots that create that trend.
How a Downtrend Is Built
A textbook bearish sequence looks like:
LH → LL → LH → LL
Sellers push price to a new low. Buyers then rally price, but the rally stops below the previous high. Sellers regain control and create another lower low.
Again, do not expect geometric perfection. Markets can retrace deeply before continuing, and a lower high may form close to the previous high.
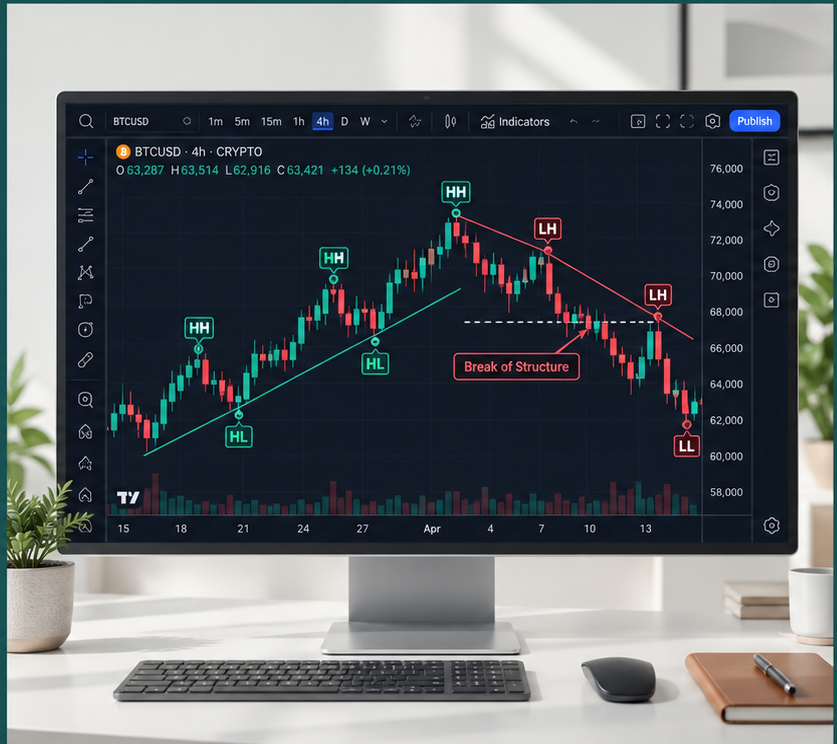
TradingView Charts
Read trend direction through swings and structure
HH, HL, LH & LL
Break Of Streucture
Affiliate disclosure: Some links on this page are affiliate links. If you sign up or purchase through these links, Trading Turtle may earn a commission at no additional cost to you. This does not influence our comparisons, ratings or editorial conclusions.
What Does a Range Look Like?
A range forms when price repeatedly rotates between a broader upper and lower boundary without sustaining a directional sequence.
Imagine a stock trading for months between ₹900 and ₹1,000. Inside the range, you may see many small higher highs and lower lows. Labelling every one can falsely imply constant trend changes.
The larger structure is simply range-bound until price establishes meaningful acceptance outside one boundary.
This is why structure must be read at the scale relevant to the trade.
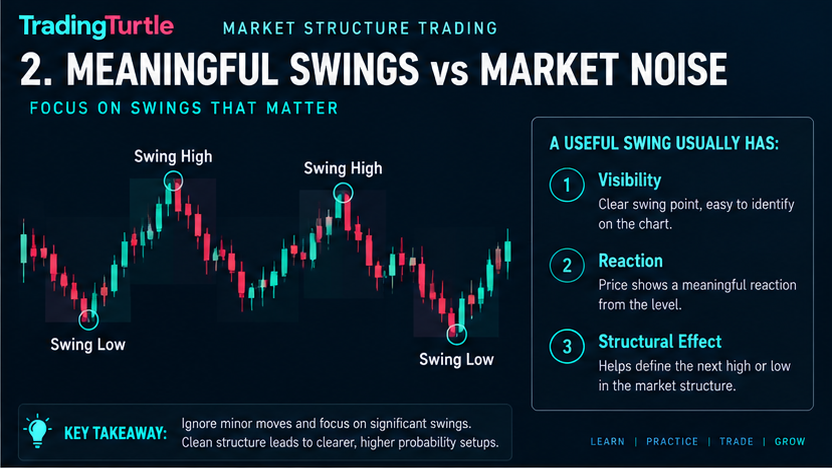
How to Choose Meaningful Swings
This is where beginners struggle most.
If every two-candle turn becomes a swing, the chart becomes unreadable. If you mark only the yearly high and low, you may miss useful information.
Use three filters:
1. Visibility
Can you see the pivot clearly without zooming in excessively? Obvious swings are a better starting point than micro-fluctuations.
2. Reaction
Did price move meaningfully away from the area? A swing that led to a strong advance or decline is generally more relevant than a tiny pause.
3. Structural effect
Did the swing create or break an important high or low? If a pivot changed the broader sequence, it deserves more attention.
Your exact rules can become more systematic later. The beginner goal is to avoid over-labelling.
Structure Depends on Timeframe
A four-hour chart and a fifteen-minute chart can show different structures at the same moment.
Suppose BTC is in a clear four-hour uptrend. During a pullback, the fifteen-minute chart may produce several lower highs and lower lows. That lower-timeframe downtrend can simply be the internal structure of the four-hour pullback.
Neither chart is wrong.
A useful hierarchy is:
- higher timeframe: broader context;
- working timeframe: structure used for the trade idea;
- lower timeframe: optional execution detail.
Decide that hierarchy before entering. Do not switch timeframes to avoid admitting that a trade is invalid.
Break of Structure: What Does It Mean?
The phrase break of structure, often shortened to BOS, is used differently across trading communities. At its simplest, it describes price moving beyond a meaningful prior swing.
For example, in an uptrend, a new move above the prior swing high can be described as a bullish structure break because buyers have extended the trend.
In a downtrend, a move below the prior swing low can extend bearish structure.
The phrase is useful only if you have defined which swing matters. If you label every tiny pivot, you will see dozens of “breaks” that have no practical importance.
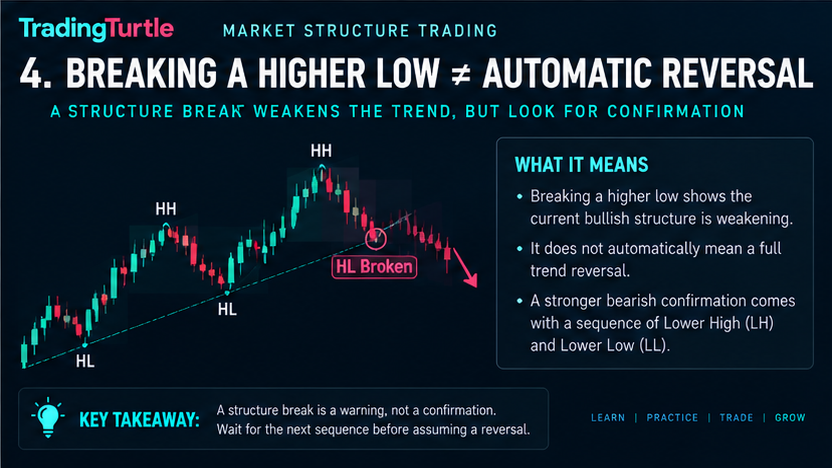
Does Breaking a Higher Low Mean the Trend Reversed?
Not automatically.
A break below a higher low tells you that the previous bullish sequence has been damaged. What happens next determines whether a new bearish structure develops.
Consider this sequence:
- Price makes a higher high.
- It falls below the previous higher low.
- It immediately recovers and makes a new high.
Calling step 2 a guaranteed bearish reversal would have been premature.
A more careful reading is:
“The prior bullish structure weakened. I now need evidence of a lower high and lower low, or another defined confirmation, before describing a full bearish trend.”
This reduces the tendency to flip opinions on every swing.
Change of Character and Other Labels
Terms such as change of character (CHoCH), market structure shift (MSS) and break of structure (BOS) are used by different trading communities, often with different rules.
Trading Turtle’s beginner approach should remain simpler:
- describe the prior sequence;
- identify the meaningful swing that was broken;
- state whether the break merely weakens the trend or establishes an opposite sequence;
- define the invalidation level.
You do not need specialist vocabulary to read structure correctly.
Market Structure and Support/Resistance
Structure becomes more informative when combined with location.
A higher low that forms at a previously important support area can be more meaningful than one appearing randomly in the middle of a range.
A lower high that forms after price retests broken support from below can show that the old level is now acting as resistance.
Read the Trading Turtle guide to support and resistance for the detailed concept.
Example
Suppose a stock breaks above ₹1,000, rallies to ₹1,080, then pulls back to ₹1,010 and turns higher.
You can interpret the ₹1,010 area in two ways:
- structurally, it may be a higher low;
- contextually, it is close to the prior resistance around ₹1,000.
The two pieces of information support the same narrative, but neither guarantees continuation.
False Breaks and Liquidity Sweeps
Price can move beyond a prior high or low only briefly and then return inside the previous structure.
For example, a stock may trade above a well-known resistance level, trigger breakout orders, then close back below it. The brief move can reflect a lack of sustained demand, profit-taking, stop activity or other order-flow dynamics.
The lesson is not that every breakout is a “liquidity grab.” That label is often used too casually.
The practical lesson is to define what counts as confirmation in your method. Some traders require a candle close. Others require a retest. Others wait for lower-timeframe structure. Whatever rule you use, test it rather than inventing it after the move.
Market Structure Trading Example: Uptrend Pullback
Imagine a stock with these daily swings:
- swing low: ₹700
- swing high: ₹780
- higher low: ₹740
- higher high: ₹820
- pullback begins
A trend-following trader may be interested in whether the pullback forms another higher low above ₹740.
Possible process:
- Broader daily structure remains bullish while the meaningful higher low holds.
- Price approaches a support area around a prior breakout.
- Lower-timeframe selling slows.
- A new higher low forms under the trader’s tested definition.
- Invalidation is below the level that would damage the bullish structure.
- Position size is calculated from the distance to invalidation rather than from confidence.
This is not a recommendation to buy at support. It is an example of how structure can organise a decision.
Market Structure Trading Example: Potential Reversal
Now consider a downtrend:
- lower high: ₹1,200
- lower low: ₹1,050
- lower high: ₹1,130
- lower low: ₹1,000
Price then rallies above ₹1,130.
That move breaks an important lower high and weakens the bearish sequence.
A cautious trader does not immediately declare a new bull market. They may wait to see whether:
- price can hold above the broken area;
- a higher low develops;
- price later makes a higher high.
The sequence matters more than the first break.
Invalidation: The Most Useful Part of Structure
Market structure becomes practical when it tells you where your interpretation stops being valid.
Suppose your thesis is:
“The four-hour market remains in an uptrend while the last meaningful higher low at ₹500 holds.”
If price decisively breaks and accepts below ₹500, your original reading must be reconsidered.
This creates a natural bridge to position sizing. If the invalidation is far away, the position may need to be smaller. If the required stop is too wide for your risk limit, skipping the trade is a valid decision.
Structure Is Not a Stop-Loss Formula
Do not automatically place a stop one tick below every swing low or above every swing high.
Obvious swings can attract concentrated orders, and normal volatility may move slightly beyond them. A stop should be based on your tested setup, market volatility and risk limit.
Our stop-loss guide explains order mechanics and common errors.
Common Market Structure Mistakes
1. Labelling every tiny movement
This creates dozens of contradictory HH, HL, LH and LL labels. Begin with major pivots.
2. Ignoring timeframe
“Bullish structure” is incomplete. State the timeframe.
3. Treating one break as certainty
A break can weaken the previous trend without establishing the opposite trend.
4. Redrawing structure after every candle
Your rules should be stable enough that two people applying the same method reach broadly similar labels.
5. Using hindsight pivots
It is easy to identify perfect swings after the entire chart has formed. In real time, the latest swing may still be developing.
6. Entering because a label appears
A higher low is not automatically a buy signal and a lower high is not automatically a short signal. Structure is context; a strategy needs entry, exit and risk rules.
7. Ignoring ranges
Not every chart is trending. Forcing trend labels into sideways conditions creates false signals.
8. Widening invalidation when price moves against you
If the level that defined the thesis fails, moving it farther away changes the original plan.
A Simple Market Structure Checklist
Before making a trading decision, answer:
- What is the timeframe?
- What are the last two meaningful swing highs?
- What are the last two meaningful swing lows?
- Is the sequence HH/HL, LH/LL or mixed?
- Is price trending or ranging?
- Is the current swing near meaningful support or resistance?
- Which level would weaken the current structure?
- Which level would clearly invalidate the thesis?
- Am I waiting for a tested setup, or trading because I labelled a pattern?
- Does the planned risk remain acceptable if execution is imperfect?
How to Practise Market Structure
Use chart replay rather than only looking at completed charts.
- Choose one liquid instrument and one timeframe.
- Hide future candles.
- Mark only the obvious swings.
- Write “uptrend,” “downtrend” or “range.”
- Record the level that would change your reading.
- Advance the chart one candle at a time.
- Update the structure only when your rules require it.
- Review whether you changed labels consistently or emotionally.
Repeat the exercise over different market conditions. The purpose is not to win simulated trades. It is to develop consistency in how you describe price.
Final Takeaway
Market structure trading is most useful when it remains simple.
Higher highs and higher lows describe an uptrend. Lower highs and lower lows describe a downtrend. Mixed swings often describe a range or transition. The important work is deciding which swings are meaningful, keeping the timeframe fixed, and recognising that a broken level changes probability rather than guaranteeing a reversal.
Use market structure to organise what has happened and define what would invalidate your reading. Then let risk management decide how much capital, if any, the idea deserves.
Frequently Asked Questions (FAQs)
HH means higher high, HL means higher low, LH means lower high and LL means lower low. They describe how current swings compare with prior meaningful swings.
Not by itself. A structure break is information about price behaviour. A trading strategy still requires tested entry, exit and risk rules.
There is no universal best timeframe. Use one that matches your intended holding period, and use higher or lower timeframes only for clearly defined context or execution roles.
Yes, on different timeframes. A daily uptrend can contain a fifteen-minute downtrend during a pullback.
No. Structure describes the sequence of swings. Support and resistance describe areas where price has previously reacted. They can complement each other.
Only enough to describe the structure relevant to your timeframe. If your chart is covered with labels, you are probably marking too many micro-swings.