Pullback Trading Strategy: How to Plan Entries Within an Existing Trend

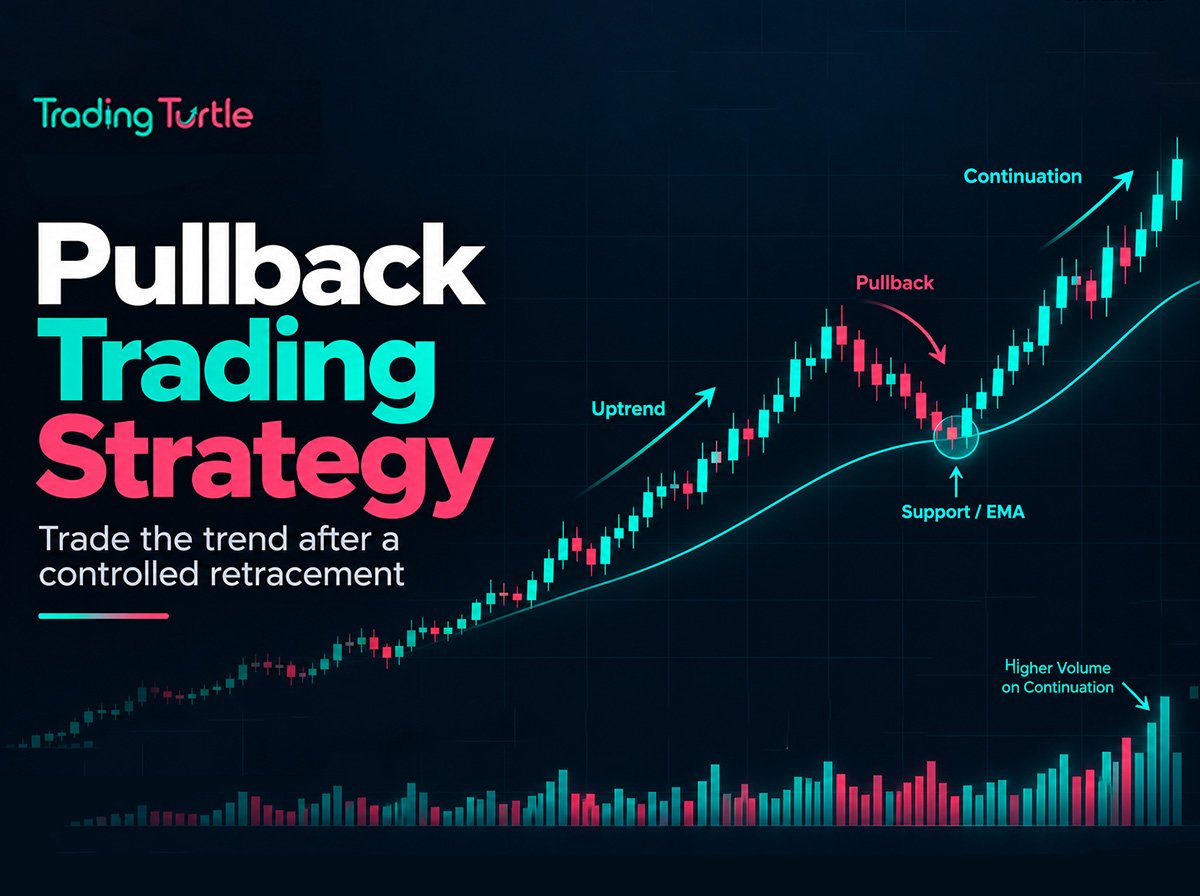
A pullback is a temporary move against a broader trend.
In an uptrend, price advances, pauses or declines, then may resume higher. In a downtrend, price falls, rallies temporarily, then may resume lower.
The appeal of a pullback trading strategy is obvious: instead of chasing price after a strong move, you wait for the market to come back toward an area where the risk can be defined more clearly.
The problem is equally obvious you do not know in advance whether the pullback will remain a pullback. It may be the beginning of a reversal.
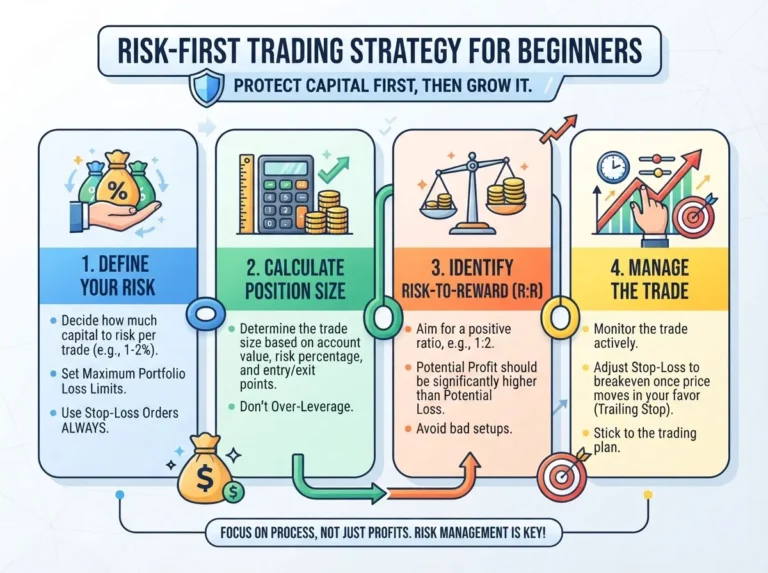
A useful framework therefore focuses less on “buying dips” and more on answering five questions:
- Is there a genuine trend?
- Is the pullback occurring at a meaningful area?
- What evidence suggests the trend may resume?
- Where is the idea invalid?
- Is the potential reward reasonable relative to the risk?
Educational disclaimer: This article is for education only. A pullback can become a full trend reversal, and no chart setup guarantees profit. Use defined risk and test any strategy before risking capital.
Key Takeaways
- A pullback is a counter-trend move within a broader trend, but it can turn into a reversal.
- Confirm the trend before looking for a pullback entry.
- Better pullback locations often align with prior structure, support/resistance or a tested dynamic reference.
- Do not enter only because price has fallen from a recent high.
- Invalidation should sit where the trend-continuation thesis no longer makes sense.
- Position size should adjust to stop distance.
- Chasing the original trend and catching a falling knife are opposite errors; a pullback plan helps avoid both.
What Is a Pullback in Trading?
A pullback is a temporary retracement against the prevailing trend.
Suppose a stock rises:
₹800 → ₹900 → ₹860 → ₹980
The move from ₹900 to ₹860 can be described as a pullback within the larger advance if the broader bullish structure remains intact and price later resumes higher.
You only know with certainty that it was a pullback after the trend resumes. In real time, it could become a reversal.
That uncertainty is why the strategy needs confirmation and invalidation.
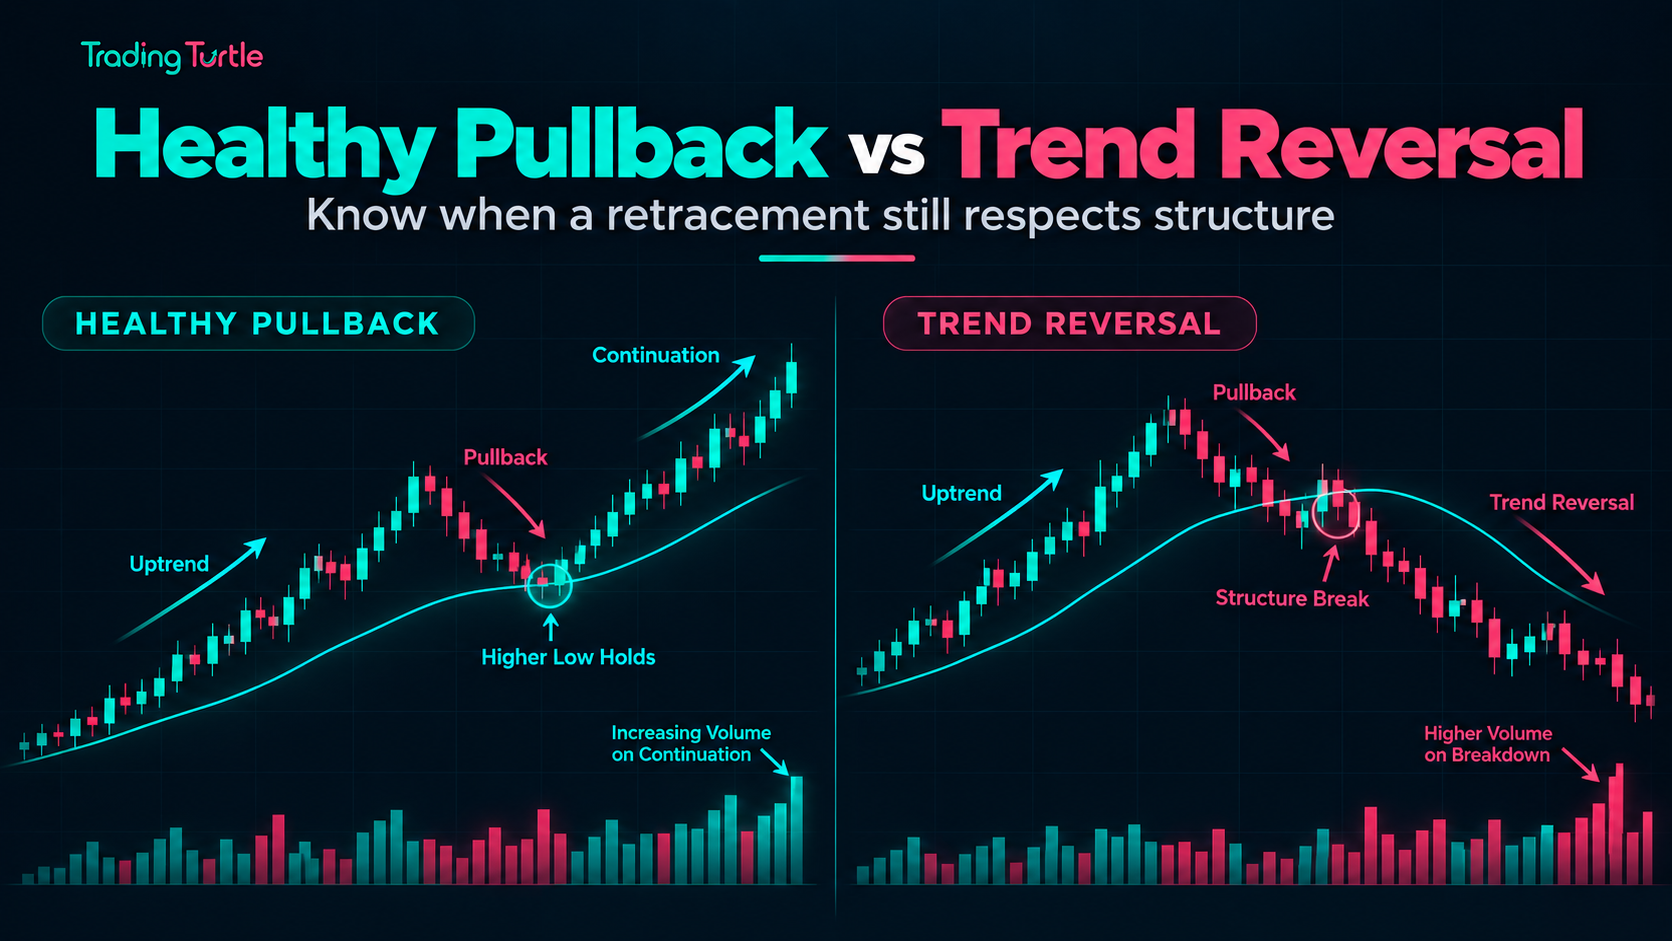
Pullback vs Reversal
A pullback is temporary. A reversal changes the broader directional structure.
Possible signs that an uptrend pullback is becoming a reversal include:
- break below a meaningful higher low;
- failure to make a new higher high;
- formation of a lower high;
- sustained weakness below prior support;
- broader market or sector deterioration.
One signal alone may not prove reversal. Use the structure rules defined in your method.
Read Market Structure Trading for HH, HL, LH and LL.
Step 1: Confirm the Existing Trend
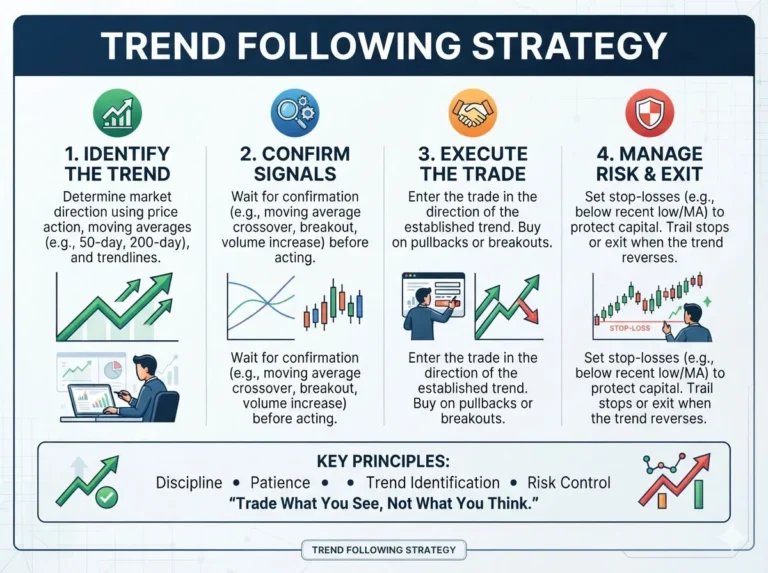
A pullback strategy requires something to pull back from.
Before looking for an entry, state:
- timeframe;
- trend direction;
- last meaningful swing high;
- last meaningful swing low.
For a bullish pullback setup, you may require a sequence of higher highs and higher lows.
For a bearish pullback, lower highs and lower lows.
Read Trend Following Strategy for Beginners and What Is a Trend in Trading?.
Step 2: Wait for Price to Return to a Meaningful Area
Do not buy merely because price is “down 3% from the high.”
Possible pullback locations include:
- prior resistance that may become support;
- prior support that may become resistance in a downtrend;
- last breakout area;
- previous swing high/low;
- moving average, if part of a tested system;
- trendline, if defined consistently;
- high-volume area or other structure reference.
The exact tool matters less than consistency.
A pullback into random mid-range space is less informative than one interacting with a level that mattered before.
Step 3: Judge the Quality of the Pullback
Not all pullbacks look the same.
A controlled retracement may show:
- smaller candles than the prior impulse;
- declining volume;
- overlapping price action;
- support holding;
- no major break of trend structure.
An aggressive reversal may show:
- expanding bearish candles in an uptrend;
- rising volume during the decline;
- gaps through support;
- break of the last meaningful higher low;
- broad market weakness.
These are observations, not guarantees.
The goal is to avoid treating every decline as a bargain.
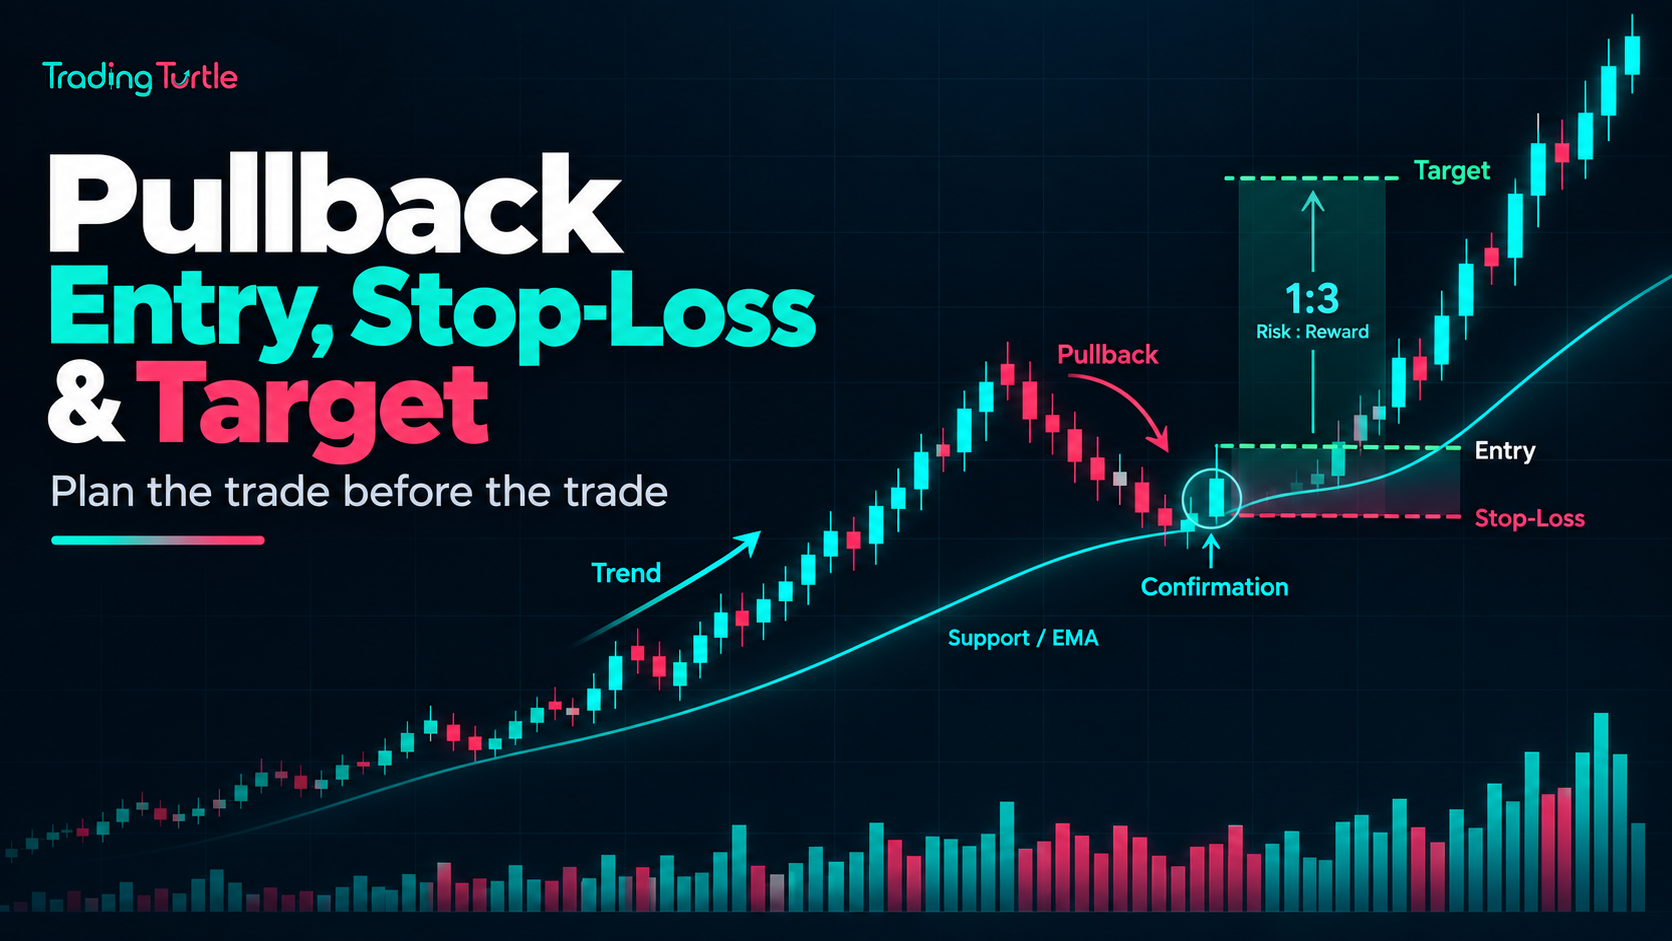
Step 4: Define Entry Confirmation
Possible pullback entry methods include:
Support rejection
Price reaches a support zone and closes back strongly within/above it under predefined rules.
Lower-timeframe structure shift
The pullback creates a small downtrend on a lower timeframe, then breaks that internal structure upward.
Break of pullback trendline
A trendline drawn consistently across the pullback is broken.
Moving-average rule
Price returns to a specific moving average and meets a defined confirmation condition.
Candlestick condition
A specific candle pattern forms at the pullback area.
Do not combine five confirmations just because more filters feel safer. Too many filters can overfit historical charts and produce few trades.
Choose a simple rule and test it.
Step 5: Define Invalidation
For a bullish pullback, invalidation may be below:
- the meaningful higher low;
- the support zone;
- the pullback low;
- a volatility-based level.
For a bearish pullback, the logic reverses.
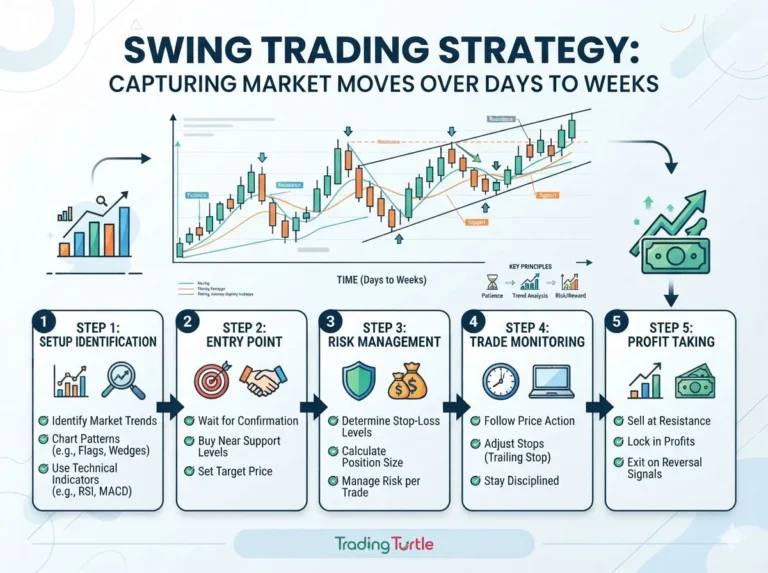
The stop should reflect where the continuation idea no longer makes sense.
Then calculate position size from the stop distance.
If the stop is too wide for your risk budget, reduce size or skip the trade.
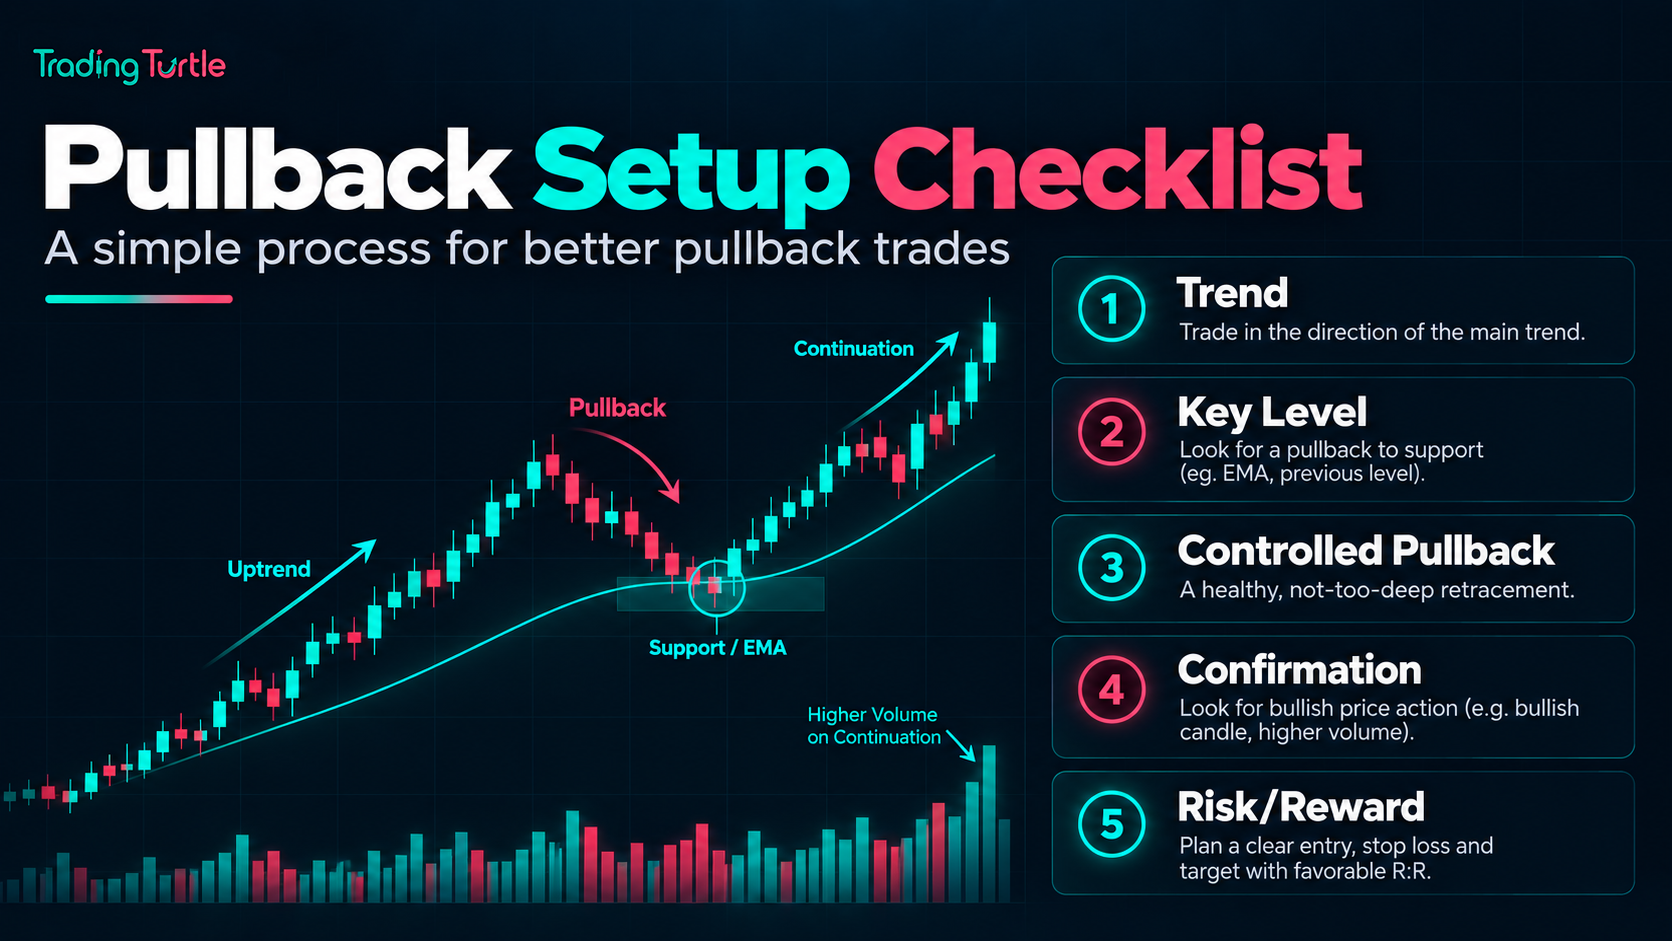
Step 6: Identify the Next Obstacle
A pullback entry should have room to move.
In an uptrend, check:
- prior high;
- major resistance;
- higher-timeframe supply area;
- round-number zone;
- strategy-specific objective.
If entry occurs at ₹980, stop is ₹950 and major resistance is ₹1,000, there may be only ₹20 of obvious room for ₹30 of risk.
The trend can still continue eventually, but the specific trade may have poor geometry.
Use risk-reward ratio as a filter after the stop and target are defined logically.
Example: Bullish Pullback
Hypothetical daily structure:
- swing low: ₹700
- higher high: ₹820
- higher low: ₹760
- higher high: ₹900
- pullback begins toward ₹830
Previous resistance near ₹820–₹830 may now be a support reference.
A tested method might require:
- broader uptrend remains intact above ₹760;
- price pulls back toward ₹820–₹830;
- four-hour structure stops making lower lows;
- entry only after a defined bullish confirmation;
- invalidation below the pullback structure;
- target near prior high or next resistance according to the exit rule.
The setup is not “buy at ₹830.” The setup is a sequence of conditions.
Example: Bearish Pullback
Hypothetical downtrend:
- swing high: ₹1,200
- lower low: ₹1,050
- lower high: ₹1,130
- lower low: ₹980
- rally back toward ₹1,040–₹1,060
A prior support area can now act as resistance.
A bearish pullback strategy might wait for the rally to stall and lower-timeframe weakness to reappear before considering an entry.
Again, the key is the broader structure and invalidation, not merely the fact that price rallied.
Pullback vs “Buying the Dip”
The phrase “buy the dip” is too vague to be a strategy.
A stock can fall 5%, then another 10%, then another 30%.
A pullback strategy is more specific:
- it requires an established trend;
- it defines the area where the retracement is relevant;
- it requires confirmation;
- it defines invalidation;
- it uses controlled position size.
Without those elements, buying a decline can become averaging into a downtrend.
Pullback Trading With Moving Averages
Some traders use moving averages as dynamic trend references.
For example:
- price remains above a rising 20-day or 50-day average;
- pullback approaches the average;
- trend-continuation signal appears.
The moving average should not be treated as magical support.
Different parameters work differently across instruments and timeframes. Price can cross an average repeatedly in ranges.
Use moving averages only if they add measurable value to your tested process.
Pullback Trading With Support and Resistance
Horizontal levels are often easier for beginners to understand.
Example:
- stock breaks above ₹500 after several failed attempts;
- rallies to ₹540;
- pulls back to ₹505;
- ₹500 becomes the key area to watch.
If price holds above the old resistance and bullish structure resumes, the pullback may offer a defined setup.
If price falls decisively back below ₹500, the breakout has failed and the original continuation thesis weakens.
Read Support and Resistance.
Pullback Trading and Volume
Volume can add context.
A trend impulse may occur with high participation, while the pullback occurs on lighter activity.
That can support a continuation interpretation.
But a low-volume pullback can still fail, and a high-volume pullback can be a healthy shakeout depending on context.
Do not make volume the only condition.
Pullback Trading and Market Regime
Pullback strategies generally make more conceptual sense in directional markets.
In a range, what looks like a pullback may simply be price rotating between boundaries.
If trend strength is weak:
- entries can trigger near the middle of the range;
- price can reverse repeatedly;
- moving averages can whipsaw.
Your strategy should include a definition of when not to trade pullbacks.
Pullback Entry Timing: Early vs Late
Early entry
Entering as price reaches the level can provide better price and tighter stop.
Risk: the pullback may continue straight through support.
Confirmed entry
Waiting for reversal evidence reduces some false entries.
Risk: price can move away before entry, giving worse reward-to-risk or a missed trade.
There is no perfect choice. Test the trade-off.
Slippage and Pullbacks
Pullbacks are often calmer than breakout entries, but fast reversals can still create slippage.
If price suddenly launches away from support, a market order may fill worse than expected.
A limit order can control price but may not fill if the market turns just above it.
This is another reason the market order vs limit order decision belongs in the strategy rules.
Common Pullback Trading Mistakes
Mistake 1: Buying every decline
A decline in a downtrend is not a bullish pullback.
Mistake 2: Ignoring the last meaningful swing
If the trend structure has already broken, continuation may no longer be the correct thesis.
Mistake 3: Entering before price reaches the planned area
Fear of missing out turns a patient pullback strategy into chasing.
Mistake 4: Using an arbitrary stop
The stop should be connected to invalidation.
Mistake 5: Catching a falling knife
Strong bearish momentum through support deserves caution, not blind dip-buying.
Mistake 6: Overloading the chart with indicators
Five indicators agreeing on the same price data do not create five independent confirmations.
Mistake 7: Ignoring broader market context
A bullish pullback setup can fail if the entire sector or index suddenly breaks down.
Mistake 8: Increasing size because entry looks “cheap”
Lower price relative to a recent high does not mean lower risk.
How to Backtest a Pullback Strategy
Define:
- trend condition;
- pullback depth or location;
- confirmation;
- stop;
- exit;
- time stop, if any;
- market/timeframe;
- costs.
Then test across different regimes.
Important questions:
- How deep are typical successful pullbacks?
- How often does structure break before continuation?
- Does the setup work in ranges?
- Does a moving-average filter help or overfit?
- How much slippage occurs during sharp reversals?
How to Paper Trade Pullbacks
Paper trading helps with patience.
The hardest part is often waiting for price to reach the planned area instead of entering early.
Record:
- trend state before pullback;
- support/resistance area;
- planned trigger;
- whether you entered early;
- invalidation;
- result in R;
- screenshot before and after.
Review whether your best trades came from following the location rule or from random dips.
Pullback Pre-Trade Checklist
- What timeframe defines the trend?
- Is the market clearly trending or ranging?
- Where is the last meaningful swing high and low?
- What area should the pullback reach?
- Has price reached it, or am I entering early?
- What confirmation does my plan require?
- What level invalidates the continuation thesis?
- What is the stop distance?
- What position size keeps risk acceptable?
- Where is the next major obstacle?
- Is the reward realistic after costs?
- Could current news or market conditions turn this into a reversal?
Final Takeaway
A pullback trading strategy is not a licence to buy every dip or sell every rally.
It is a structured way to participate in an existing trend after price temporarily moves against it.
The strategy becomes useful when you can define the trend, the pullback area, confirmation, invalidation and risk before the outcome is known.
Some pullbacks become reversals. That cannot be eliminated. The job of risk management is to make that failure manageable while allowing valid continuation trades enough room to develop.
Frequently Asked Questions (FAQs)
A pullback is a temporary move against the broader trend. In an uptrend it is a decline or consolidation; in a downtrend it is a temporary rally.
There is no perfect real-time test. A break of meaningful trend structure, failure to make a new trend high/low, and sustained movement through key support/resistance can be warning signs.
There is no universally best moving average. Any parameter should be tested on the instrument, timeframe and strategy rather than copied from another trader.
Some strategies do; others wait for confirmation. Immediate entries can offer better price but higher failure risk. Test one consistent rule.
At a level that invalidates the continuation thesis under your method. Position size should then adjust to the stop distance.
Neither is universally better. They have different trade-offs. Breakouts can move quickly but experience false breaks and slippage; pullbacks can offer better entry location but may become full reversals.