Trading Volume Explained: What Volume Tells You—and What It Does Not

Trading volume is one of the simplest pieces of market data and one of the easiest to misuse.
A volume bar tells you how much trading activity occurred during a period. It does not tell you whether buyers are stronger than sellers in a simple one-sided sense, because every completed trade has both a buyer and a seller.
What volume can tell you is whether participation is relatively active or quiet, whether a price move is attracting more trading activity than usual, and whether an instrument may have enough turnover to support your intended trade size.
Used well, volume adds context. Used badly, it becomes another reason to predict a move that the chart has not confirmed.
Educational disclaimer: This article is for education only. Trading volume is descriptive market data, not a prediction of future price or a recommendation to trade.
Key Takeaways
- Trading volume measures the quantity of shares, contracts or units traded during a period.
- Every completed trade has both a buyer and a seller, so high volume does not mean “more buyers than sellers.”
- Volume can help assess participation, liquidity and the significance of price moves.
- A breakout on high volume can be more notable than one on very low activity, but it still can fail.
- Volume differs across stocks, futures, options and crypto markets, so compare like with like.
- Raw volume should be interpreted relative to the instrument’s normal activity and timeframe.
- Volume is most useful when combined with price structure, spread, liquidity and risk management.
What Is Trading Volume?
Trading volume is the total quantity of an asset traded during a chosen period.
For stocks, volume is commonly expressed as the number of shares traded.
For futures, it is commonly the number of contracts traded.
For crypto spot markets, platforms may report units of the base asset or quote-currency value depending on the metric.
Suppose 1,000 shares of ABC Ltd change hands during a five-minute candle. That candle’s volume is 1,000 shares.
If another five-minute candle has 25,000 shares traded, participation was much higher during that second period.
The number becomes useful when compared with the instrument’s own history.
How Volume Appears on a Chart
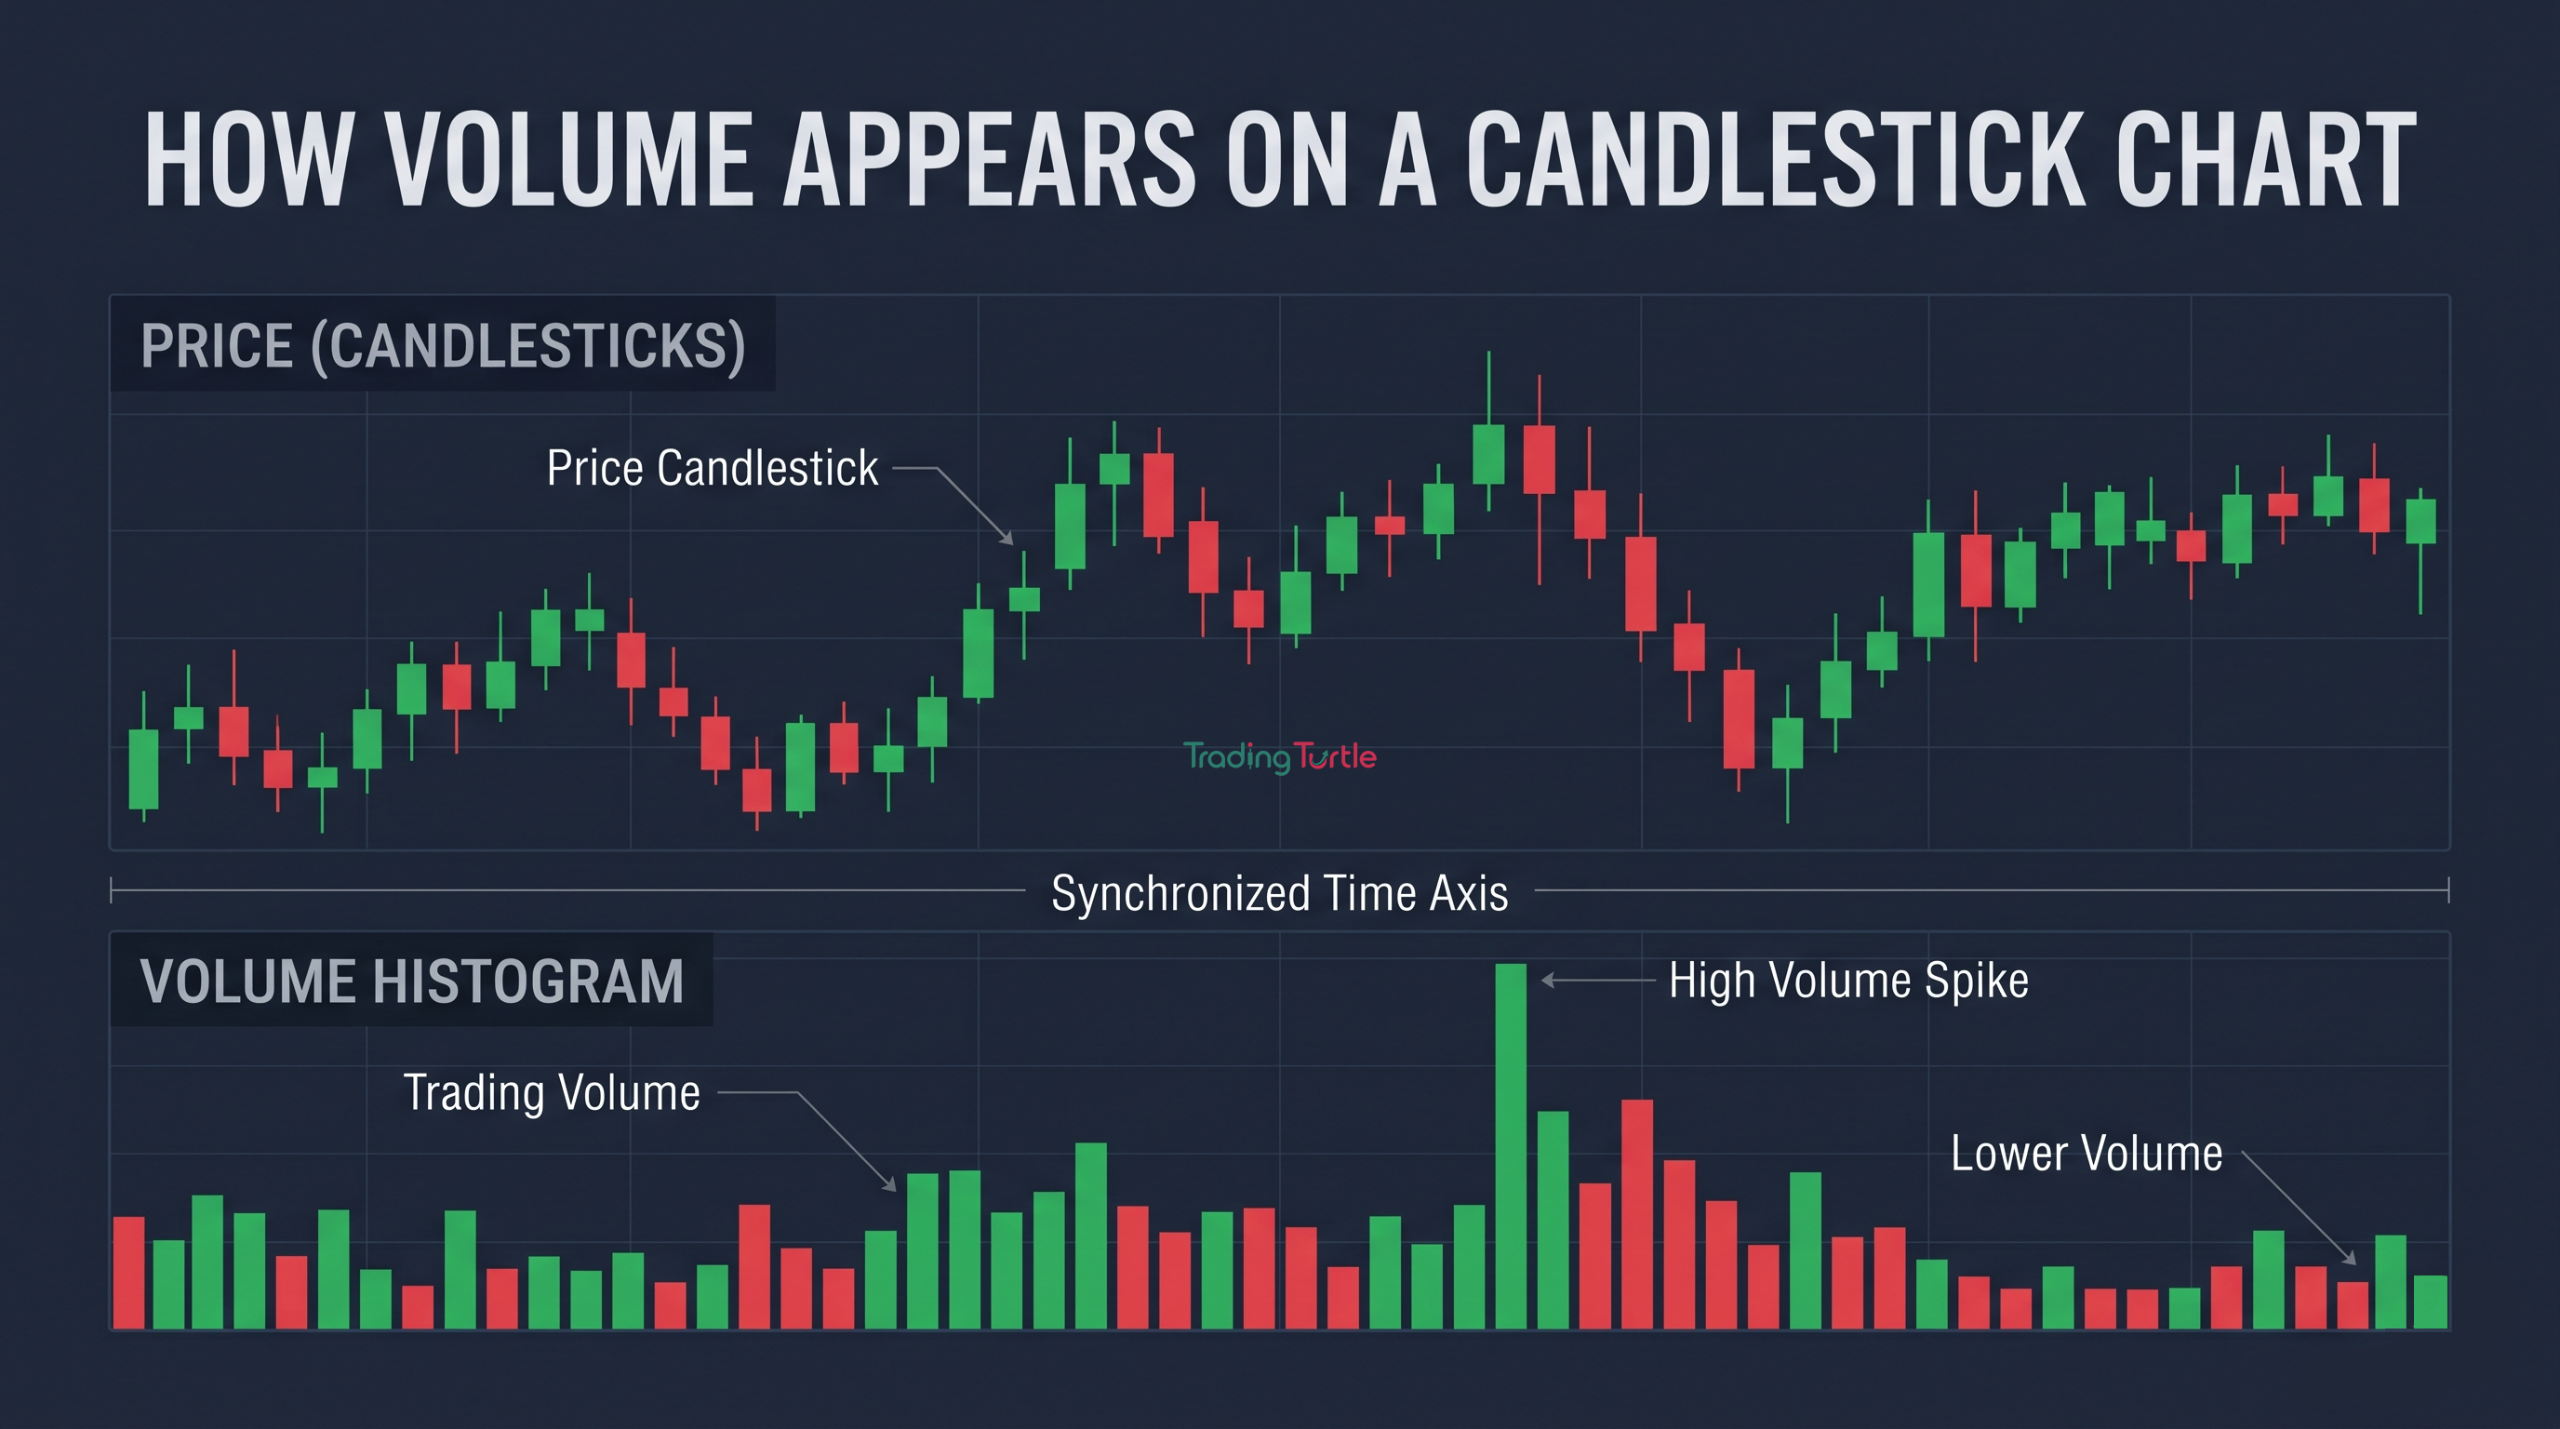
Most charting platforms display volume as vertical bars beneath price.
Each bar corresponds to the same timeframe as the price candle.
If you are viewing a daily chart, one volume bar normally represents the day’s activity.
If you are viewing a 15-minute chart, one bar represents activity during that 15-minute period.
Platforms may colour volume bars according to whether the corresponding candle closed up or down. Do not confuse that colour with a precise measure of “buy volume” versus “sell volume.” The underlying classification method can vary.
Why Every Trade Has a Buyer and Seller
A common beginner statement is:
“Volume was high because there were more buyers than sellers.”
That is not literally correct for completed trades.
A trade occurs because a buyer and seller agree to transact at a price.
What changes is aggressiveness.
If buyers are willing to keep paying higher offers, price can rise. If sellers keep accepting lower bids, price can fall.
Volume measures how much trading occurred while that price discovery was happening.
This distinction helps you avoid simplistic interpretations.
Trading Volume vs Liquidity
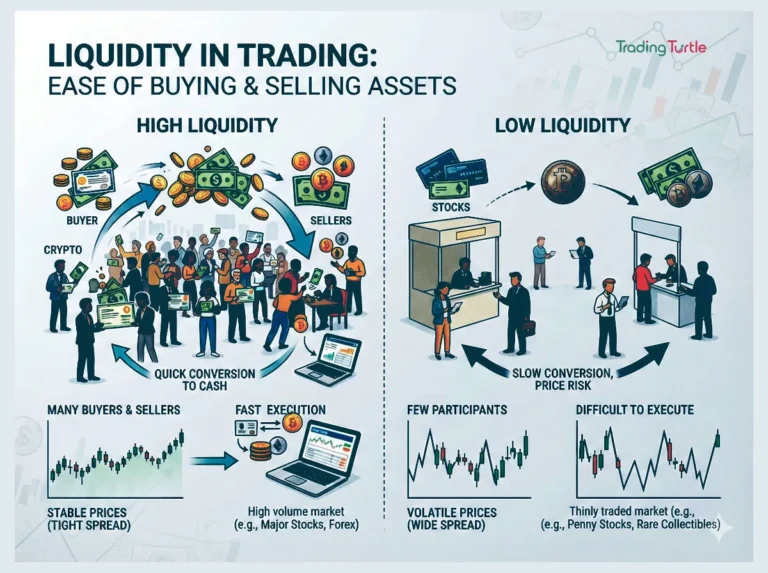
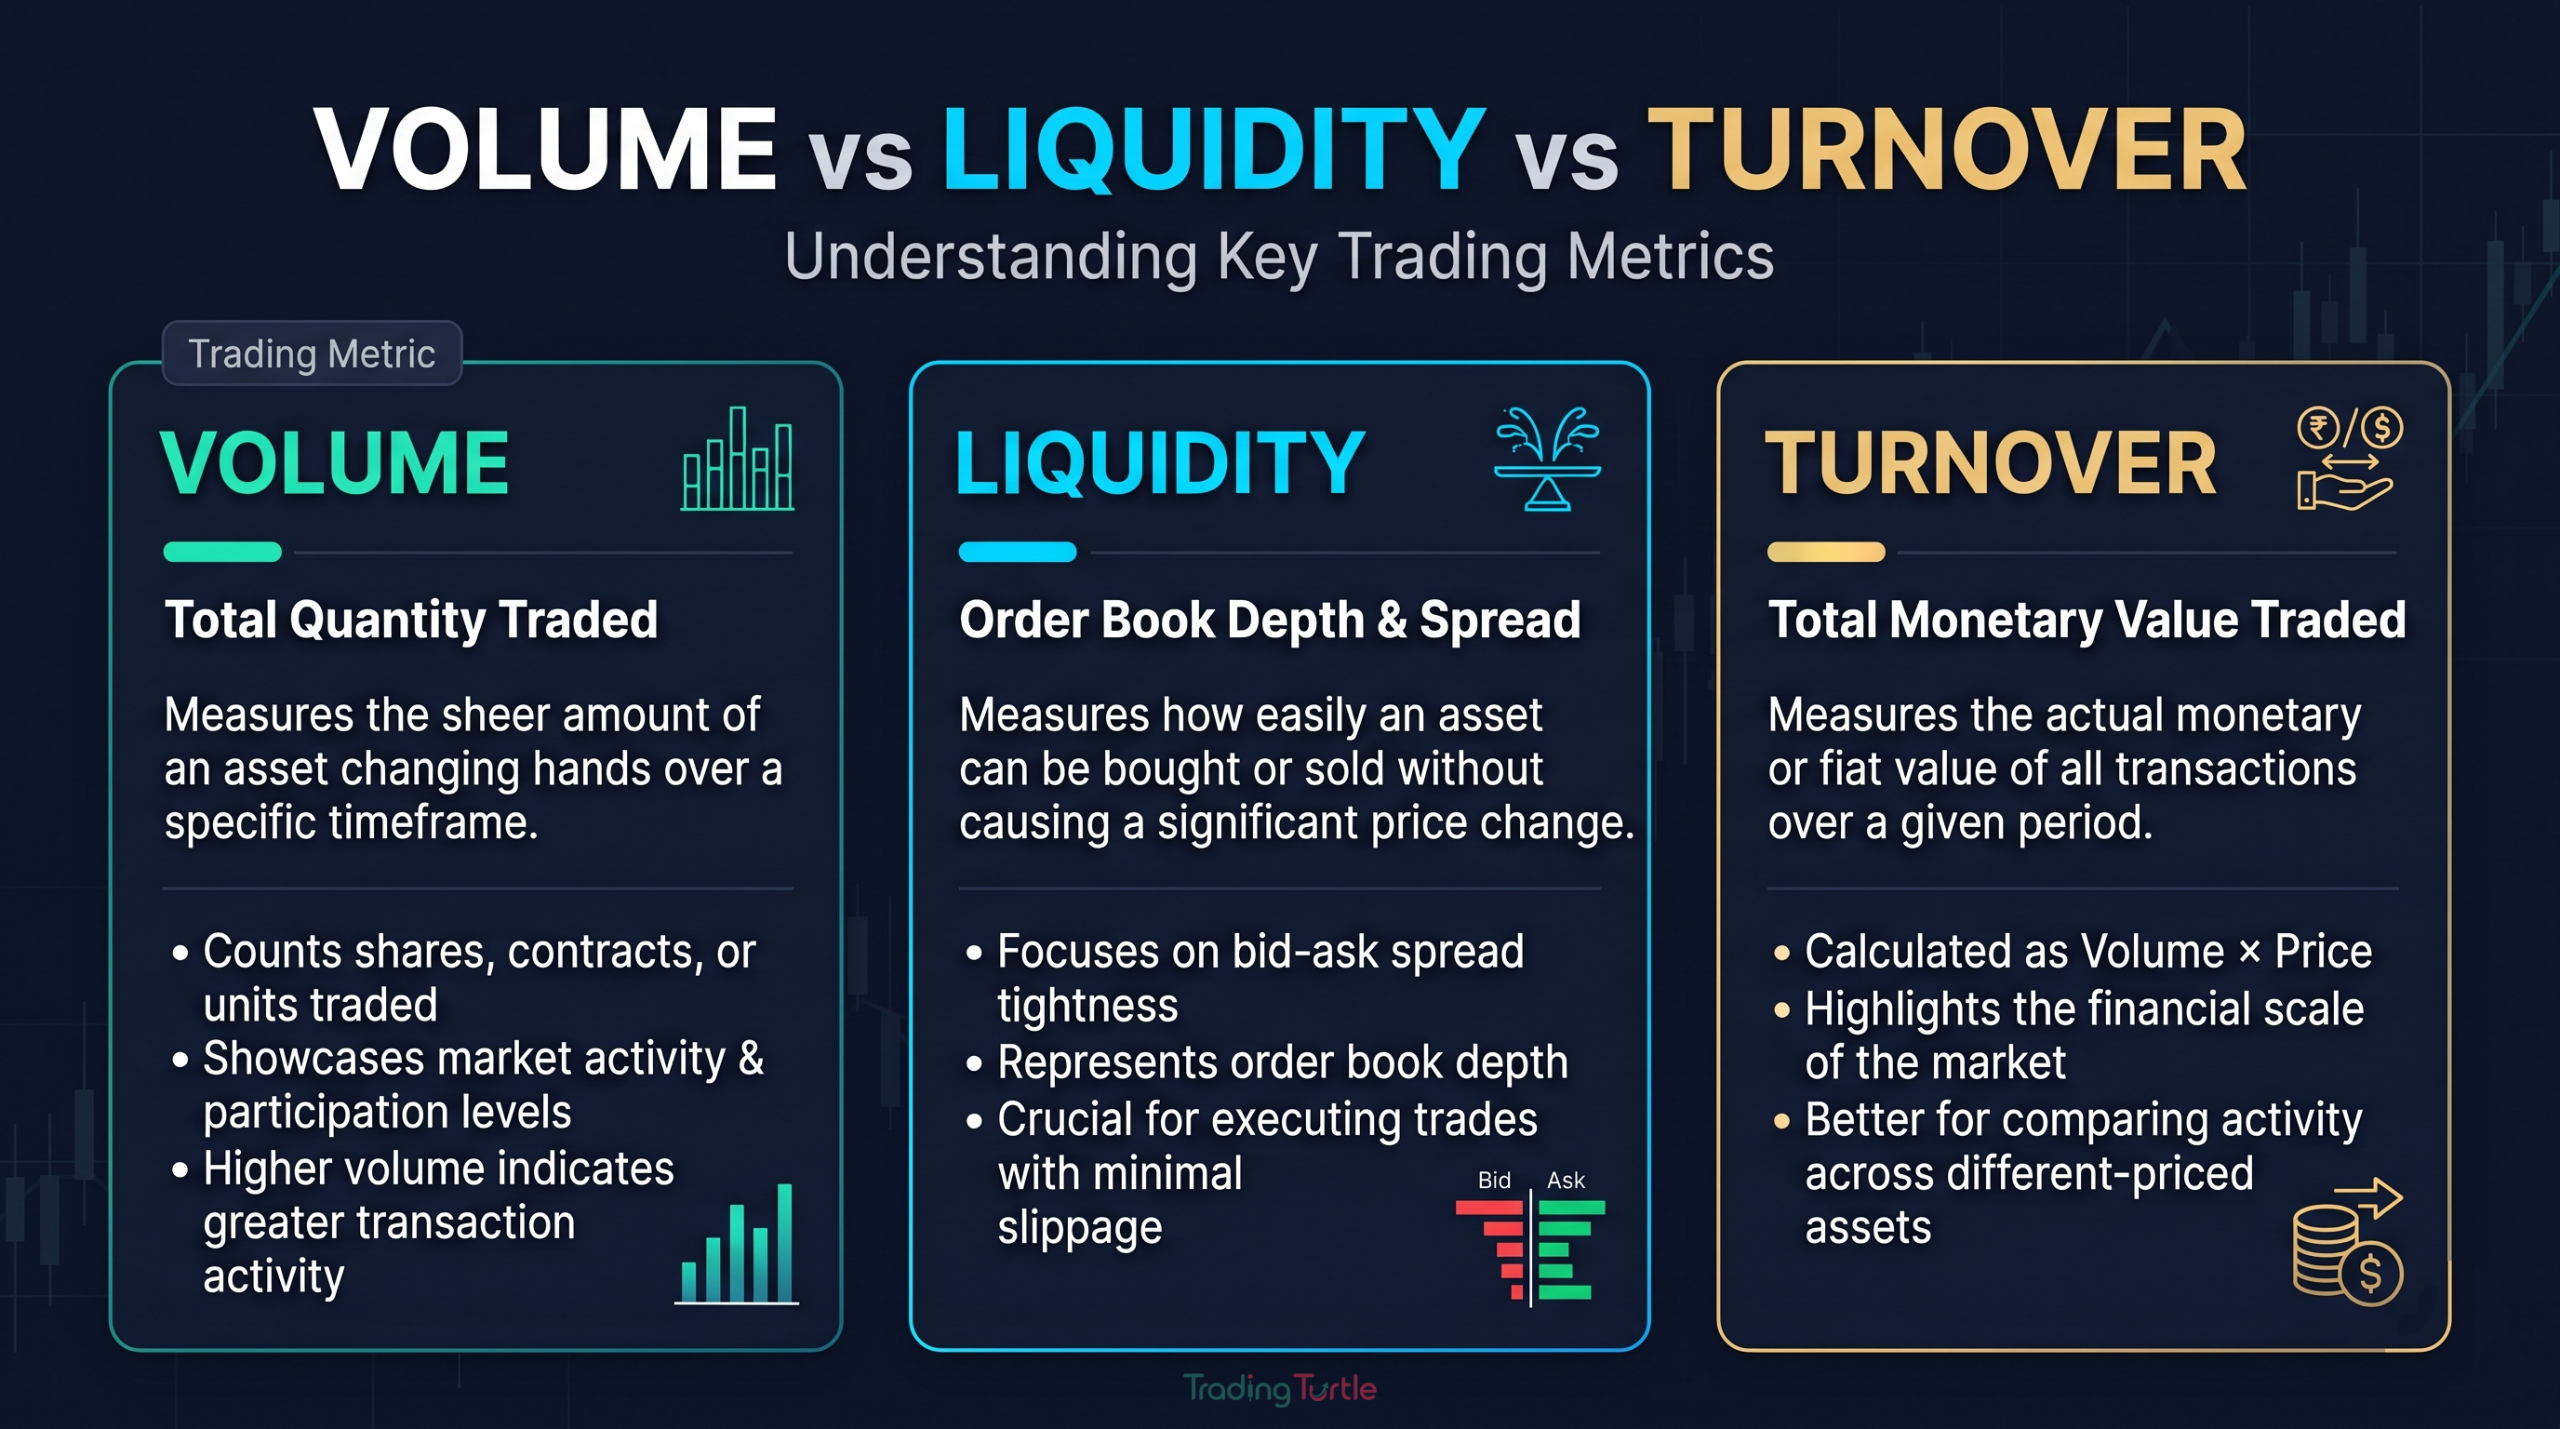
Volume and liquidity are related but not identical.
A high-volume instrument is often liquid, but liquidity also depends on:
- bid-ask spread;
- order-book depth;
- number and behaviour of participants;
- quantity available near current prices;
- market conditions.
An instrument may report high daily volume but still have a wide spread at a quiet time of day.
Another may have moderate daily volume but a deep, stable order book during its main session.
Read What Is Liquidity in Trading? for the full distinction.
Why Traders Watch Relative Volume
Raw volume is hard to interpret without context.
One million shares can be enormous for a small company and ordinary for a heavily traded large-cap stock.
That is why traders often compare current volume with:
- the average of recent periods;
- the same time of day in prior sessions;
- volume during previous breakouts;
- volume at important support/resistance areas.
The goal is not to find a magic threshold. It is to answer:
“Is today’s participation unusually strong or weak for this instrument?”
Volume and Breakouts
Suppose a stock has traded between ₹500 and ₹550 for several weeks.
It finally moves above ₹550.
Two scenarios:
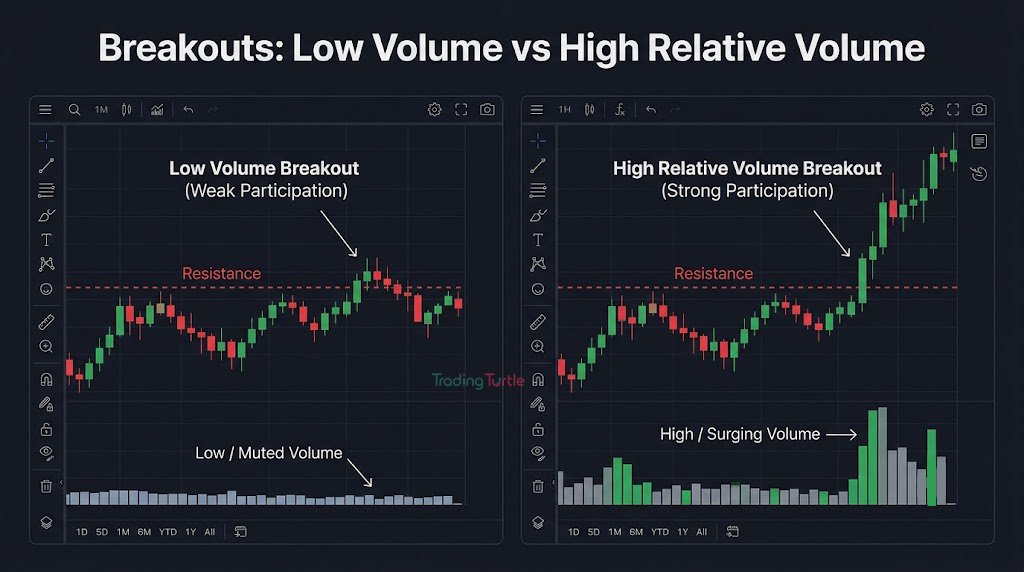
Scenario A: Breakout with unusually low volume
Price trades to ₹553, but activity is much lower than normal. The move may still continue, but the lack of participation gives you less evidence that many market participants are engaging with the breakout.
Scenario B: Breakout with high relative volume
Price moves above ₹550 while volume expands sharply compared with recent sessions.
That shows the level attracted substantial activity.
It does not prove the breakout is genuine. High-volume breakouts can fail, especially around news, index rebalancing or short covering.
Use volume as context, not confirmation by itself.
Volume and False Breakouts
A false breakout occurs when price moves beyond an important level and then returns inside the prior range.
Volume can sometimes help explain the move.
For example:
- low-volume breakout + immediate rejection can suggest weak participation;
- high-volume breakout + sharp reversal can suggest intense two-sided activity and trapped participants.
The same high volume can therefore appear in both successful and failed breakouts.
Price behaviour after the level remains essential.
Volume at Support and Resistance
Volume can help you study whether market interest increases near a key level.
Imagine a stock repeatedly finds support around ₹800.
On the next test:
- price trades briefly below ₹800;
- volume expands sharply;
- the candle closes back above the area.
The volume tells you that significant activity occurred during the rejection. It does not tell you exactly who will control the next move.
Combine it with support and resistance and market structure rather than treating it as a standalone signal.
Volume and Trend
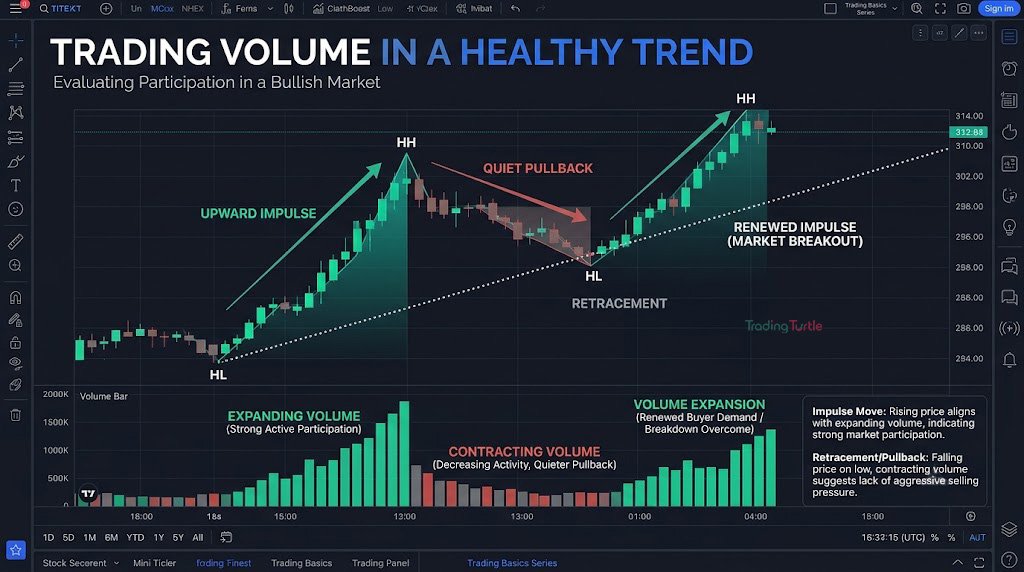
In a healthy directional move, traders sometimes look for participation to expand during strong impulse moves and contract during quieter pullbacks.
Example of a possible bullish pattern:
- price advances with rising volume;
- pullback occurs on lower volume;
- next breakout attracts renewed volume.
This can support the trend narrative.
But markets do not follow this pattern perfectly. A mature trend can continue on declining volume for a long time. Volume can spike near a market top or bottom because of panic, forced liquidation or profit-taking.
Read What Is a Trend in Trading? before using volume to label direction.
Volume Spikes
A volume spike means activity is much higher than nearby periods.
Possible reasons include:
- earnings or company news;
- economic data;
- index changes;
- institutional rebalancing;
- large block activity;
- liquidation or short covering;
- market panic;
- a major breakout or breakdown.
The correct question is not “Volume spiked, should I buy?”
Ask:
“Why did participation increase, where did price close relative to the important level, and what does the next price behaviour show?”
Volume in Stocks
Stock-market volume can help beginners assess whether a share is actively traded.
Before entering a small-cap or lesser-known stock, check:
- recent average daily volume;
- spread;
- order-book depth;
- unusual one-day spikes;
- whether activity is stable or concentrated in a few events.
A sudden surge after weeks of inactivity may not mean the stock has become permanently liquid.
For large positions, average daily volume alone is not enough. Compare your intended size with real market depth.
Volume in Futures
Futures volume counts contracts traded.
It is often analysed alongside open interest, which measures outstanding contracts that remain open.
Volume tells you how much trading occurred during the period. Open interest tells you how many contracts remain open after positions are created, closed or transferred.
The two metrics answer different questions.
Do not treat rising futures volume alone as evidence that “new money is long” or “shorts are increasing.” Directional interpretation requires more context.
Volume in Options
Options volume is contract-specific.
A single stock can have many strikes and expiries, so activity is fragmented.
An option contract may show high volume for one day but still have a wide spread or low open interest.
Before trading options, check the specific contract rather than the underlying stock’s volume alone.
Options also add volatility, time-decay and pricing risks that are outside a basic volume discussion.
GoCharting
Practice trades and learn the platform without risking real money
Sim Trader • Virtual Funds • Advanced Charts • Trade Review

Volume in Crypto
Crypto volume requires extra care because trading occurs across many exchanges, pairs and venues.
A “24-hour volume” number on one exchange does not necessarily represent the entire market.
Different data providers may aggregate venues differently, exclude suspicious volume, or convert assets using different price references.
For execution, the volume and order book on the specific exchange and pair you use matter more than a global headline number.
Volume vs Turnover
Volume counts quantity. Turnover usually refers to the monetary value traded.
Example:
100,000 shares of a ₹50 stock = ₹50 lakh turnover.
100,000 shares of a ₹2,000 stock = ₹20 crore turnover.
The same share volume can represent very different rupee value.
Turnover can therefore help compare economic activity, while volume helps understand quantity traded.
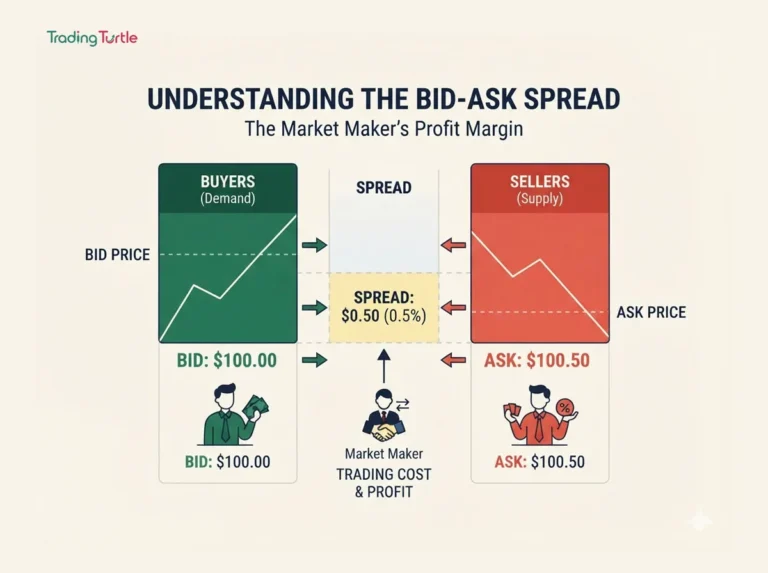
Volume and the Bid-Ask Spread
High participation often supports tighter spreads, but not always.
During news:
- volume can surge;
- volatility can surge;
- market makers and participants can widen quotes;
- slippage can increase.
So “high volume” does not guarantee easy execution.
Check the actual bid-ask spread when placing an order.
Common Volume Indicators
Volume moving average
A moving average of volume helps compare current activity with recent periods.
On-Balance Volume — OBV
OBV accumulates volume based on whether price closes up or down. It tries to summarise whether volume is occurring more on advancing or declining periods.
Volume Profile
Volume Profile distributes traded activity across price levels rather than only time periods.
VWAP
Volume-weighted average price combines price and volume to estimate an average traded price over a period.
Each tool has different assumptions. Beginners do not need all of them at once.
Understand raw volume first.
Common Trading Volume Mistakes
Mistake 1: “High volume means buy”
High volume means high activity. It can occur during rallies, crashes, reversals and ranges.
Mistake 2: Comparing unrelated instruments by raw volume
One million shares means different things for different stocks.
Mistake 3: Ignoring timeframe
A daily volume spike may disappear when viewed in a longer historical context.
Mistake 4: Assuming candle colour equals buyer/seller volume
Colouring methods are simplified and platform-dependent.
Mistake 5: Ignoring spread and depth
Volume alone does not guarantee good execution.
Mistake 6: Treating volume as prediction
Volume describes activity that already happened.
A Practical Volume Checklist
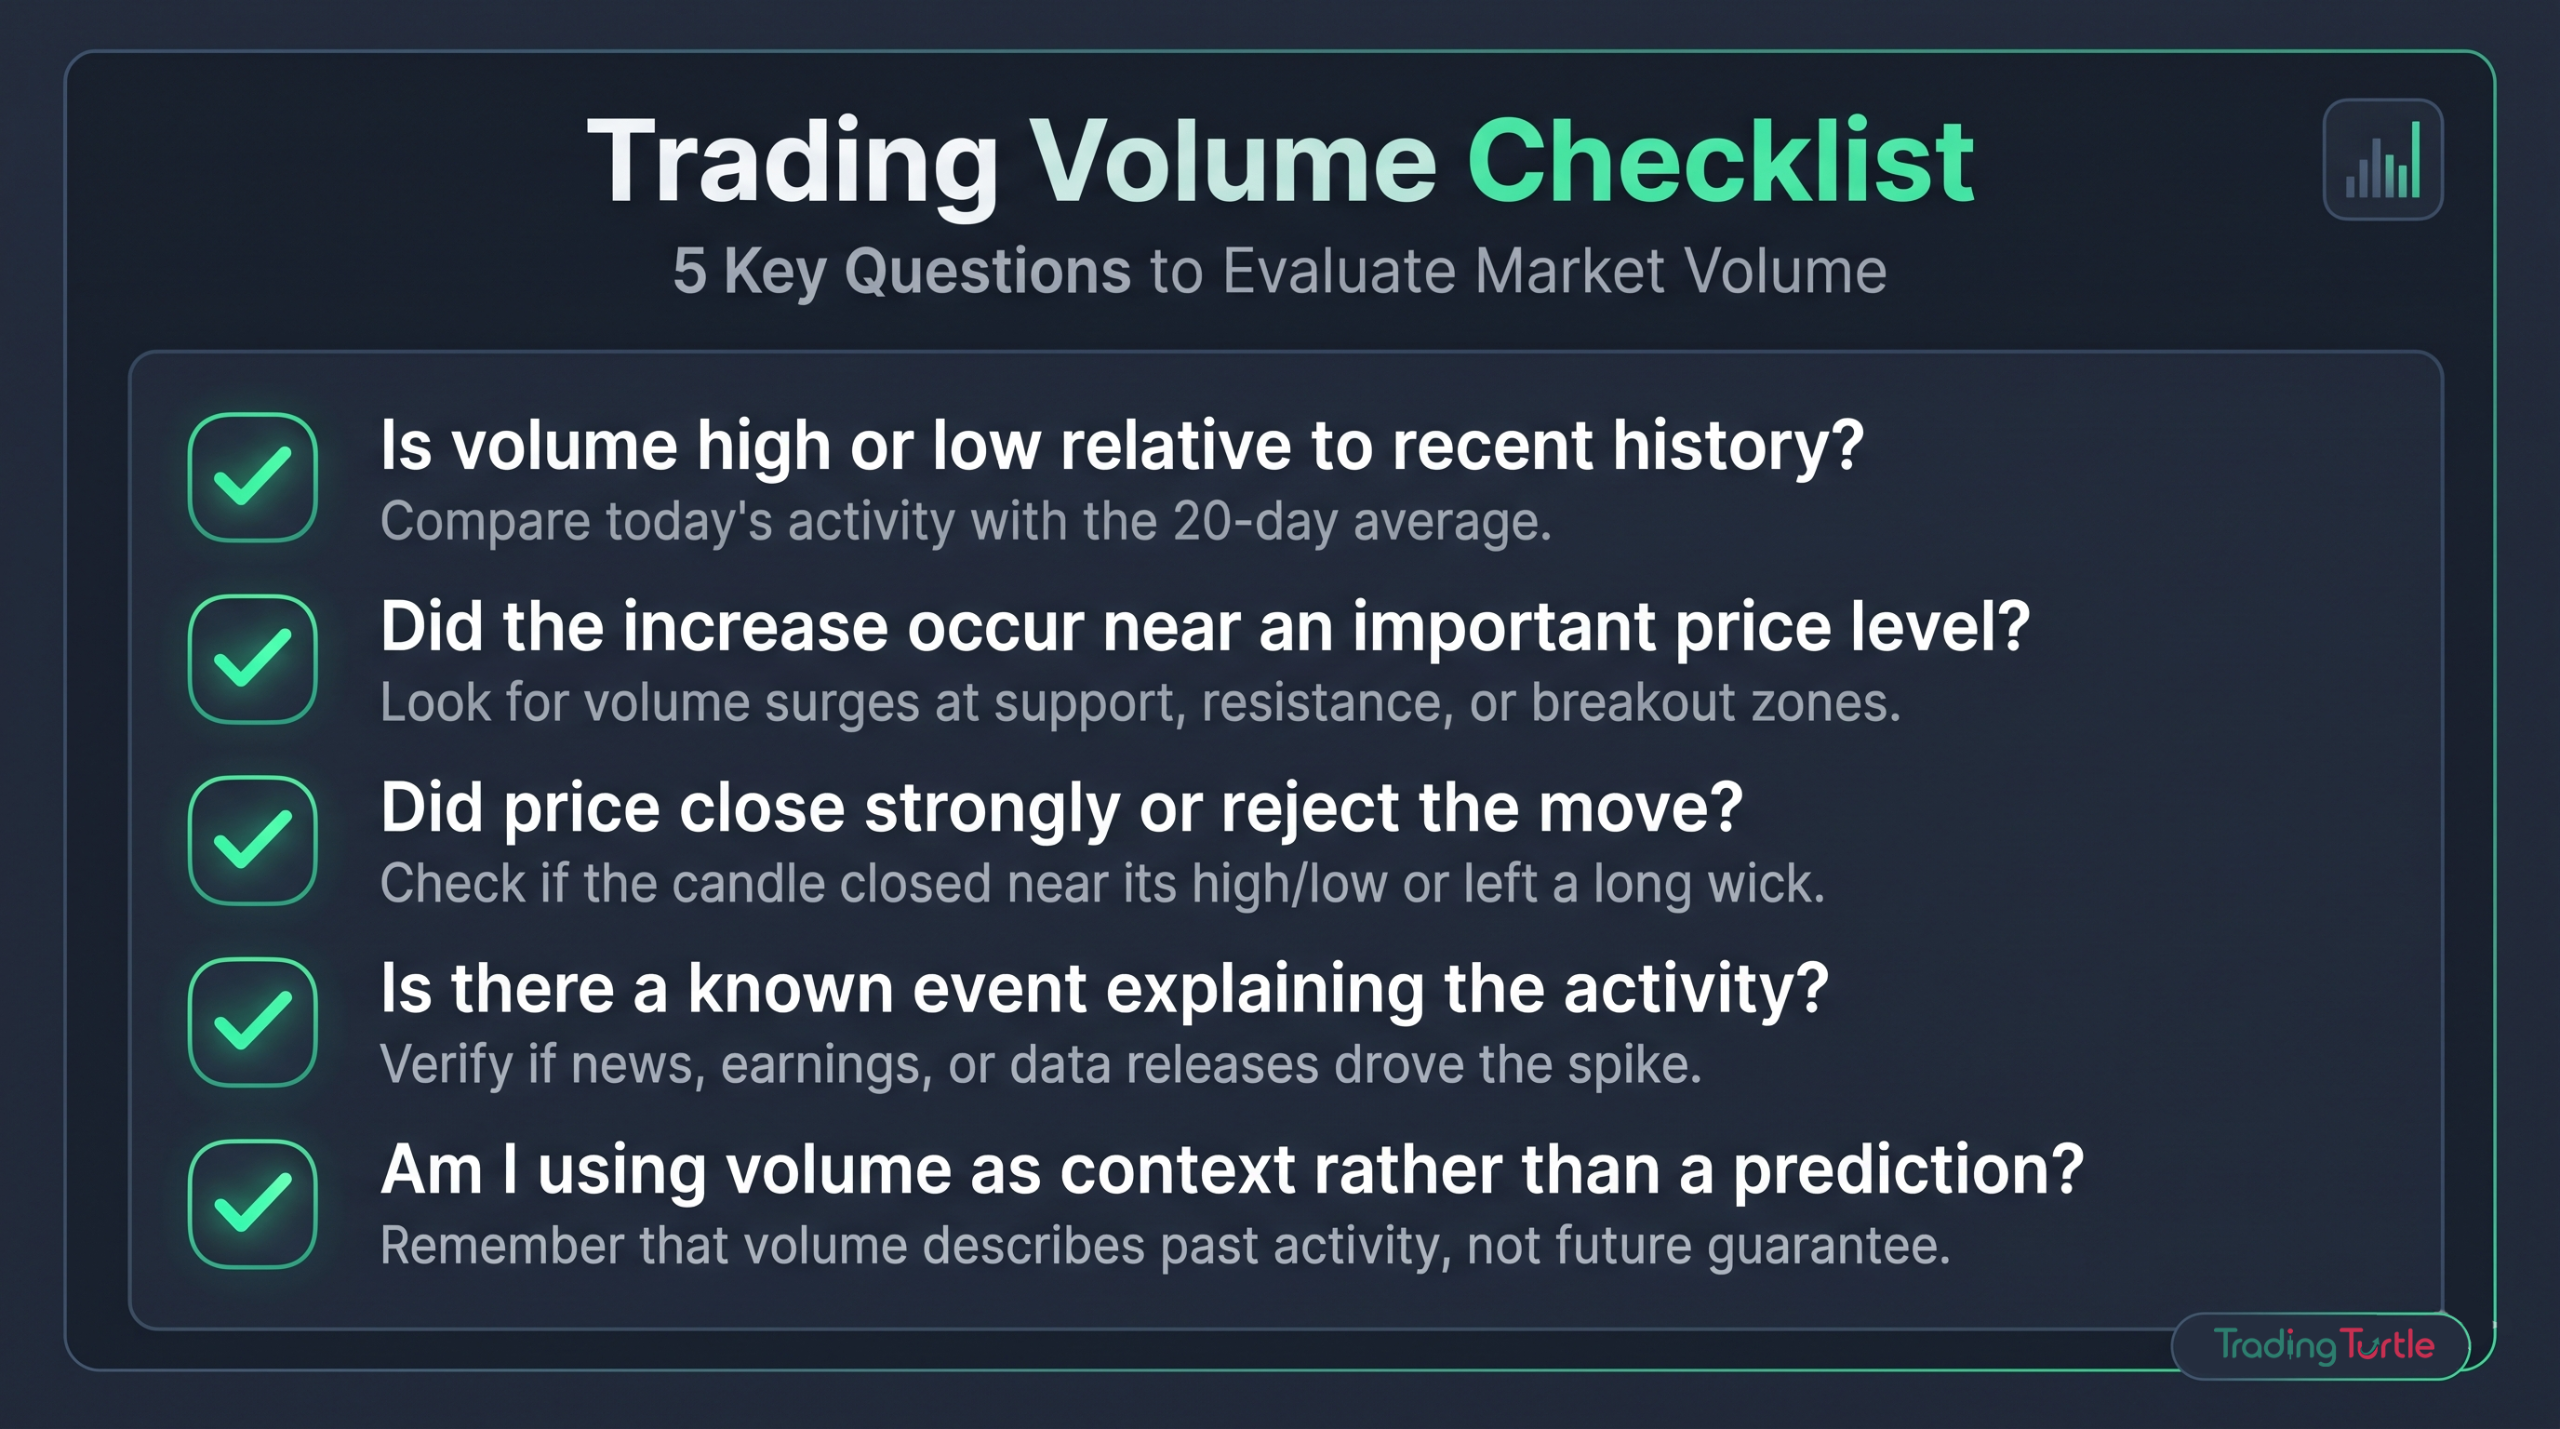
When volume catches your attention, ask:
- Is volume high or low relative to the instrument’s own recent history?
- Did the increase occur near an important price level?
- Did price close strongly or reject the move?
- Is the spread normal or unusually wide?
- Is there a known event explaining the activity?
- Does market structure support the same interpretation?
- Is my intended order small relative to available liquidity?
- Am I using volume as context or as an excuse to predict?
How to Practise Reading Volume
Choose one liquid instrument and review 50 historical sessions.
For each major volume spike, note:
- date;
- price location;
- whether it occurred during a breakout, reversal or news event;
- what happened over the next several bars;
- whether spread or volatility also changed.
You will quickly see that volume does not produce one universal outcome.
That lesson is more useful than memorising “high volume = bullish.”
Final Takeaway
Trading volume tells you how much activity occurred, not what must happen next.
It becomes useful when you compare it with normal activity, price structure, important levels, liquidity and execution conditions.
Use volume to ask better questions:
- Is participation expanding?
- Is this move unusually active?
- Is the market liquid enough for my order?
- Did a breakout attract real activity or occur in a quiet market?
Do not use it as a substitute for a trading plan or risk management.
Frequently Asked Questions (FAQs)
It means a relatively large quantity of the asset traded during the measured period. It does not automatically mean price will rise or fall.
Neither by itself. High volume can accompany rallies, sell-offs, reversals or major news. Interpret it with price behaviour and context.
It can be a warning sign, but liquidity also depends on spread, order-book depth and available quantity. Check several measures.
Relative volume compares current activity with a historical baseline, helping show whether the instrument is trading more or less actively than usual.
No. Volume counts contracts traded during a period. Open interest counts outstanding derivatives contracts that remain open.
No. Volume can help evaluate participation around a breakout, but even high-volume breakouts can fail.