Layer-2 Blockchain Economics: Why More Transactions Do Not Always Mean More Value


A Layer-2 network can process more transactions while earning less revenue per transaction. That is not necessarily a contradiction: lower fees may improve the user experience, while the economics depend on costs, repeat demand and who ultimately captures the value created.
This analysis uses Base’s published fee structure as a starting point for understanding Layer-2 blockchain economics. It explains which measurements matter, why activity rankings can mislead and how to separate network adoption from a claim about any particular investment.
Analysis date: 15 November 2026. This article does not report a live revenue total, estimate Coinbase earnings or assume a right to network cash flows for a token holder. All numerical business examples are hypothetical.
Table of Contents
- Begin with what the network charges for
- Transactions measure activity, not necessarily demand quality
- The arithmetic of lower fees and higher usage
- A simple revenue-and-cost bridge
- What sustainable demand would look like
- Incentives can change the interpretation
- Network success and investment value are separate questions
- Cheap transactions do not remove operational risk
- A balanced scorecard for the next comparison
- Frequently asked questions
Begin with what the network charges for
Base’s network-fee documentation describes an execution component and an L1 publication or security component. Charges can vary with network conditions and the work a transaction requires. The documentation also discusses a minimum execution base fee and explains that an execution-only illustration excludes the L1 component.
The analytical lesson is simple: the fee visible to a user and the cost incurred by the network are related, but they are not the same measure. A lower average fee may be commercially useful while changing the network’s margin on each action.
Readers who want the architectural background can explore What Is Base Blockchain? and What Is OP Stack?. This article focuses on the business interpretation of activity rather than repeating a technical introduction.
Transactions measure activity, not necessarily demand quality
A transaction count tells us that recorded actions occurred according to the dataset’s definition. It does not independently tell us why the actions happened, how much value they created or whether users would continue without incentives.
One application can generate many inexpensive automated interactions. Another can support fewer but more valuable customer actions. Ranking the two solely by transaction count would miss the difference in purpose.
The same caution applies to active-address counts. An address is not automatically a person, and a person may use several addresses. A contract or automated service may also generate substantial activity. Good analysis preserves the dataset’s terminology rather than quietly converting addresses into unique human users.
Useful follow-up evidence includes repeated activity across comparable periods, the distribution of use across applications and whether the observed behaviour persists after a temporary campaign ends. These checks do not solve identity perfectly, but they improve the interpretation.
The arithmetic of lower fees and higher usage
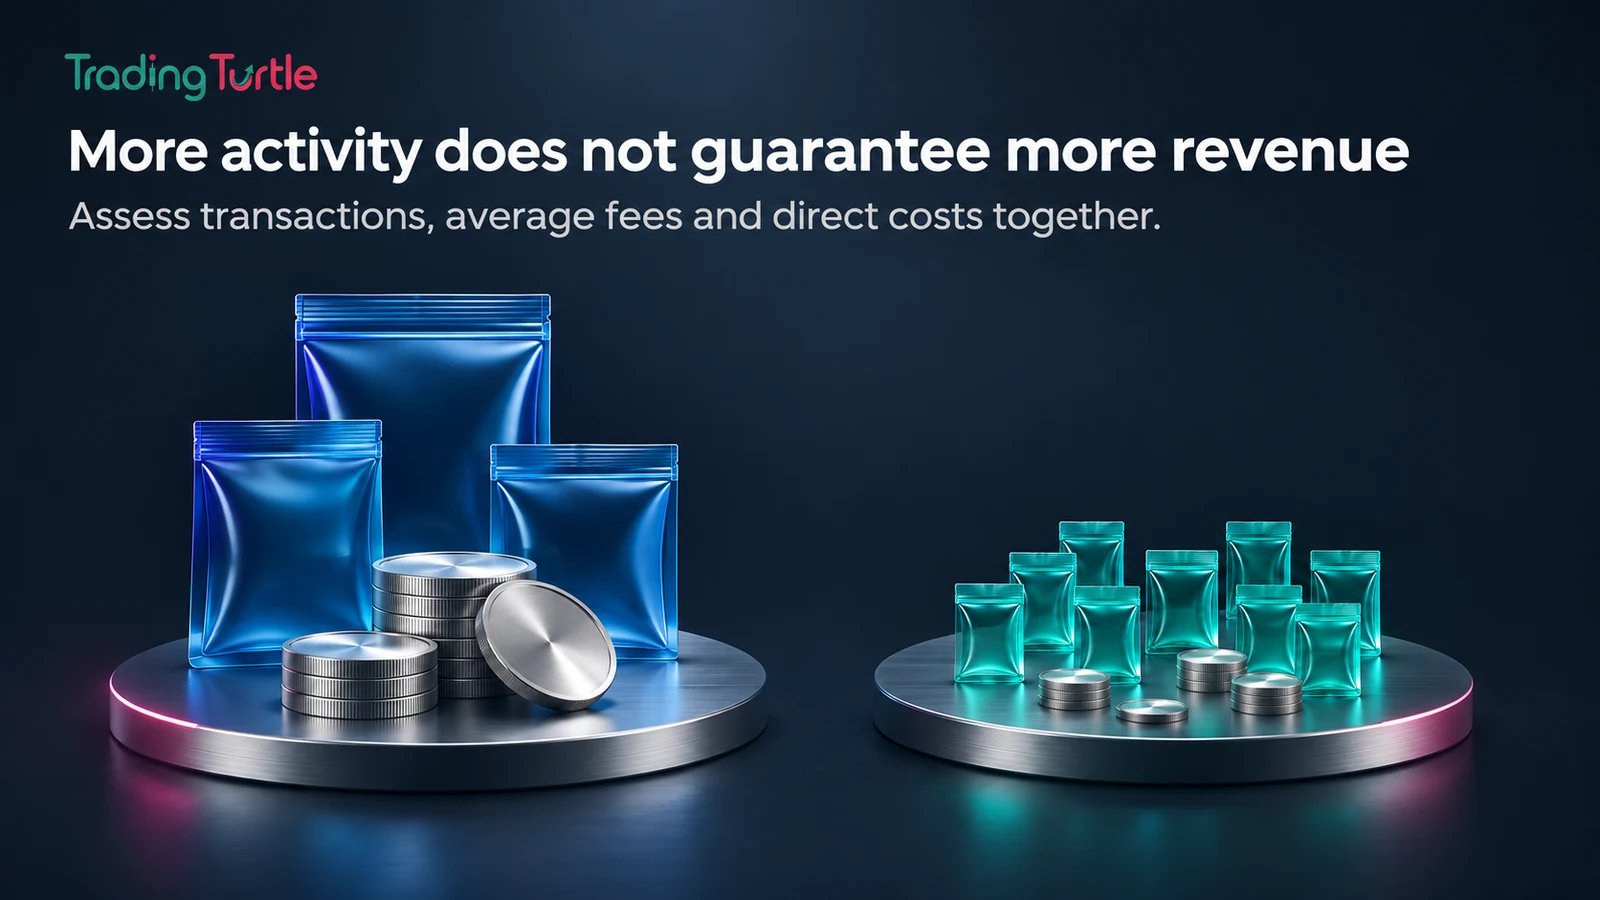
Imagine a hypothetical network processing one million transactions at an average user fee of $0.01. The gross amount charged would be $10,000. If activity doubles to two million transactions but the average fee falls to $0.004, the gross amount becomes $8,000.
Usage rose by 100%, yet the gross fee total fell by 20%. Neither number establishes profitability because the example has not included costs. It simply shows why “more transactions” cannot be substituted for “more revenue.”
Now imagine that cost per transaction also falls. A lower gross fee total could still coexist with improved economics if the relevant costs fall sufficiently. Alternatively, costs could remain stubborn while revenue compresses.
The point is to calculate the relationship rather than choose the most attractive metric. Activity, pricing and cost efficiency belong in the same analysis, with clearly stated definitions.
A simple revenue-and-cost bridge
Start with the fees actually paid for the measured activity. Then identify the associated publication, settlement or other direct costs covered by the dataset. State which expenses remain outside it, such as development, staffing, infrastructure or other business obligations.
A margin calculated from onchain fee receipts minus a narrow cost category should not automatically be described as audited corporate profit. The measure may still be useful, provided its scope is explicit.
For illustration, a project receiving $10,000 in user fees and paying $3,000 in a specified direct cost has $7,000 remaining before every excluded expense. Calling the remainder “net profit” would overstate the calculation unless all relevant items had been included.
This discipline matters when comparing dashboards. Two sources can use the same word, such as revenue, while including different components. Read their methodology before placing their numbers side by side.
What sustainable demand would look like
Sustainable demand means users continue to find the service useful under ordinary conditions. Evidence could include repeat use, applications that retain customers and activity spread across more than one temporary event.
It also helps to ask what customers are paying for. Low-cost transfers, trading, consumer applications and other activities can have different usage patterns and willingness to pay. Treating them as a single homogeneous category can hide important changes.
A network can deliberately keep fees low to encourage adoption. Whether that strategy creates durable value depends on what develops around it and how the relevant businesses capture returns. There is no universal threshold at which a transaction count proves success.
For a research note, write the adoption hypothesis in ordinary language. “Users return because the application solves a repeated problem” is a testable idea. “Activity is bullish” is too vague to evaluate carefully.
Incentives can change the interpretation
Rewards and promotional campaigns can attract experimentation. That may be useful for product discovery, but it complicates comparisons between incentivised and ordinary periods.
An analyst should ask what changed when the incentive began and what happened when it ended. Did users return? Did they use more than the rewarded action? Did useful activity diversify, or did it remain concentrated in a narrow pattern?
Avoid assuming every incentivised action is worthless. Equally, avoid counting all rewarded activity as evidence of lasting demand. The appropriate interpretation depends on behaviour after the temporary reason to participate changes.
This is one reason a longer observation window can be more informative than a one-day ranking. The window should still be chosen consistently rather than selected because it produces a preferred conclusion.

Network success and investment value are separate questions
A useful network can create benefits for users, application developers and service providers without distributing those benefits equally. Before making an investment inference, identify the legal or economic claim associated with the instrument being considered.
Does the holder receive an explicit cash flow? Is there a contractual entitlement, a governance role or only exposure to market demand? Are revenues retained by a separate operating business? Those questions cannot be answered by a transaction chart alone.
The same applies when analysing a listed company involved in an ecosystem. A network-level measure is not automatically the company’s reported revenue or profit. Corporate reporting, ownership arrangements and the scope of the measured activity must be reconciled.
This article therefore makes no claim that rising Base use guarantees a return for any asset. The appropriate conclusion is conditional: useful adoption can support an economic opportunity, but value capture requires its own evidence.
Cheap transactions do not remove operational risk
Fees are only one dimension of a network’s usefulness. Reliability, software risks, administrative controls and the ability to move assets also matter. A low quoted cost does not establish that every transaction will execute as intended under every condition.
Readers should verify current technical arrangements in primary documentation when they matter to a decision. Do not infer present security features from an old launch article or assume that all networks grouped under “Layer 2” have identical designs.
If an analysis includes bridge performance or withdrawal timing, define the route and product. A native route and a third-party liquidity service can involve different assumptions. A general claim of instant movement can conceal conditions that become important during stress.
Our Blockchain Basics resources offer starting points for understanding these distinctions. The economic assessment should remain connected to the practical user experience.
A balanced scorecard for the next comparison
Record the measured period and source for activity, average fee and fee receipts. Define whether active addresses or transactions are being counted. Note any major campaign or methodological change.
Add the direct cost measures that can be verified, and clearly list excluded costs. Examine repeated use and concentration across applications where credible data permits. Keep dollar-denominated measures separate from native-asset quantities so a price change does not masquerade as operational growth.
Finally, write the value-capture question explicitly. Identify the beneficiary and the evidence connecting activity to that beneficiary. If the link is uncertain, retain the uncertainty instead of filling it with a token-price narrative.
That scorecard turns an impressive activity number into a set of questions a reader can investigate. It also makes later updates easier because the method stays consistent as the data changes.
Frequently asked questions
Does higher transaction count mean higher Layer-2 revenue?
Not necessarily. Average fees, transaction mix and measurement definitions matter. A network can process more actions while charging less in total if its average fee falls sufficiently.
Are active addresses the same as active users?
No. One person can use several addresses, and automated systems can generate activity. Address data should be described accurately rather than converted into a human-user count without evidence.
Is onchain revenue the same as company profit?
No. A dashboard may cover only selected receipts and costs. Corporate profit requires the appropriate accounting scope and all relevant expenses, rather than a narrow onchain subtraction.
Can a successful network guarantee a token investment return?
No. The holder’s claim, supply dynamics, valuation and value-capture mechanism require separate analysis. Network usefulness alone does not establish an investment outcome.
Sources and method: Base network-fee documentation, reviewed 15 November 2026. Business frameworks and numerical examples are original illustrations, not measured Base financial results. No live revenue ranking or investment recommendation is asserted.